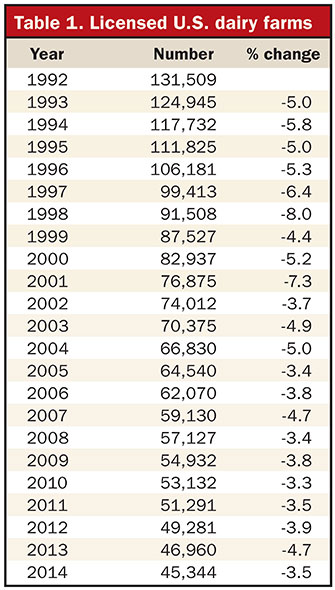
Record milk checks received by U.S. dairy producers last year were a principal reason that the smallest number of dairy farmers left the business since tracking of commercial dairy farms began in 1992. Only 1,631 farms exited the dairy industry, and that represented the lowest total next to 2010's 1,800. On a percentage basis, only three years yielded lower losses - 3.3 percent in 2010 and 3.4 percent in both 2005 and 2008 - as shown in Table 1. Overall, there were 45,344 dairy farms in the U.S.
That combination of fewer farms and steady cow numbers once again caused the nation's average herd size to climb to a new record. At 204 cows per herd, the U.S. herd grew by eight cows this past year (see Table 2). That growth in cows per herd was just one off of the prior year's record of nine since this survey on commercial dairy farms first took place in 1992.
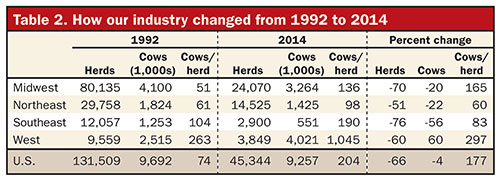
Table 1 shows the 23-year history detailing the number of dairy farms holding permits to sell milk. Since 1992, the drop in licensed, or so-called commercial, dairy farms has declined 86,165 from 131,509 to 45,344. That's a 66 percent drop during that time.
Among states with over 1,000 dairy operations - exactly 10 - farm numbers fell only 3.1 percent compared to 3.5 percent nationally. When comparing those numbers to the remaining 40 states with fewer than 1,000 farms each, 4.9 percent exited the business last year. That accelerated trend in the smaller dairy states has been taking place for some time.
Table 2 provides an overview of the last 23 years of change. Nationally, average herd size has gone up 177 percent, from 74 to 204 cows. Regionally, the West (+297) and the Midwest (+165) have seen the largest percentage gains in herd size.
Western herds added 47 cows per herd last year bringing its average to over 1,000 cows per operation for the first time. That growth in cows was on top of adding 33 and 49 cows each of the two prior years.
Meanwhile, the Midwest (+8) matched the national growth rate. The Southeast grew (+2) in herd size, to hover six cows under the national average, while Northeast herds treaded water holding at 98 cows. From 2004 to 2014, gains ranged from 0 to 3 head annually in the Northeast, which was the slowest growth in the nation.
For only the second time in the past 12 years, the Midwest had the largest share of farms calling it quits this past year (Table 3). The 5.1 percent total yielded 1,300 dairy farms that left the business. The Midwest also had the most exits in 2011.
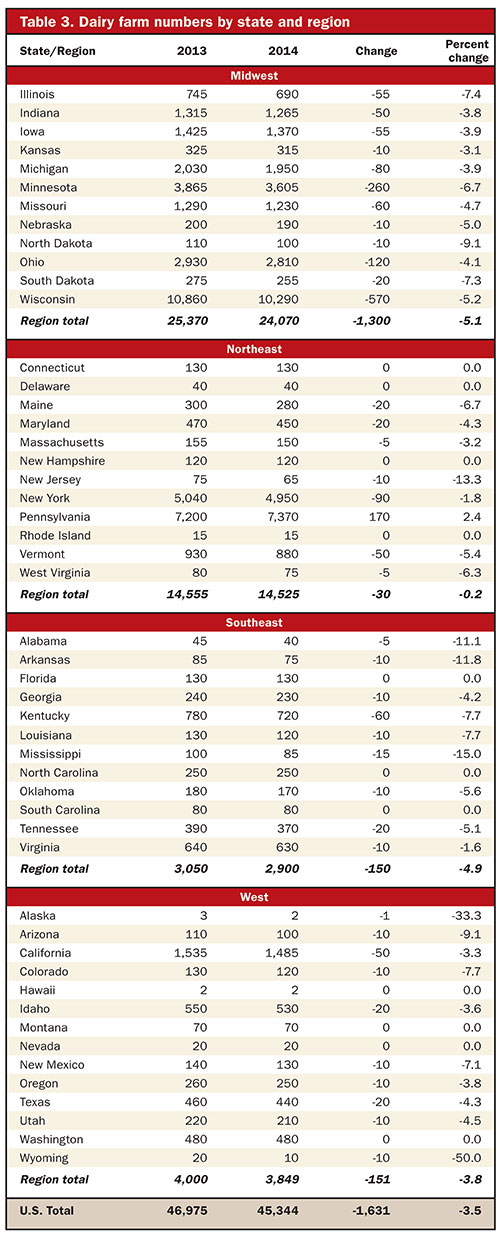
Next was the Southeast which lost 4.9 percent of its dairy operations. Outside of the Midwest, the Southeast was the only other region to see the most departures in the past 12 years on a percentage basis leading that category 10 times. Since 1992, the Southeast has lost more operations than any other area as farms fell from 12,057 to 2,900 . . . a drop of 9,157 or 76 percent. Cow numbers followed suit; there are 702,000 fewer cows, a 56 percent drop.
This marks the sixth straight year the Northeast has retained the most dairy farms among all regions. Pennsylvania stands second in herd numbers following Wisconsin's 10,290 dairy farms and bucked the national trend by adding 170 dairy farms to bring its total to 7,370 operations. All other states remained steady or realized a reduction in dairy farm numbers.
This article appears on page 155 of the Mar 10, 2015 issue of Hoard's Dairyman.
Return to the Hoard's Dairyman feature page.
That combination of fewer farms and steady cow numbers once again caused the nation's average herd size to climb to a new record. At 204 cows per herd, the U.S. herd grew by eight cows this past year (see Table 2). That growth in cows per herd was just one off of the prior year's record of nine since this survey on commercial dairy farms first took place in 1992.
Table 1 shows the 23-year history detailing the number of dairy farms holding permits to sell milk. Since 1992, the drop in licensed, or so-called commercial, dairy farms has declined 86,165 from 131,509 to 45,344. That's a 66 percent drop during that time.
Among states with over 1,000 dairy operations - exactly 10 - farm numbers fell only 3.1 percent compared to 3.5 percent nationally. When comparing those numbers to the remaining 40 states with fewer than 1,000 farms each, 4.9 percent exited the business last year. That accelerated trend in the smaller dairy states has been taking place for some time.
Table 2 provides an overview of the last 23 years of change. Nationally, average herd size has gone up 177 percent, from 74 to 204 cows. Regionally, the West (+297) and the Midwest (+165) have seen the largest percentage gains in herd size.
Western herds added 47 cows per herd last year bringing its average to over 1,000 cows per operation for the first time. That growth in cows was on top of adding 33 and 49 cows each of the two prior years.
Meanwhile, the Midwest (+8) matched the national growth rate. The Southeast grew (+2) in herd size, to hover six cows under the national average, while Northeast herds treaded water holding at 98 cows. From 2004 to 2014, gains ranged from 0 to 3 head annually in the Northeast, which was the slowest growth in the nation.
For only the second time in the past 12 years, the Midwest had the largest share of farms calling it quits this past year (Table 3). The 5.1 percent total yielded 1,300 dairy farms that left the business. The Midwest also had the most exits in 2011.
Next was the Southeast which lost 4.9 percent of its dairy operations. Outside of the Midwest, the Southeast was the only other region to see the most departures in the past 12 years on a percentage basis leading that category 10 times. Since 1992, the Southeast has lost more operations than any other area as farms fell from 12,057 to 2,900 . . . a drop of 9,157 or 76 percent. Cow numbers followed suit; there are 702,000 fewer cows, a 56 percent drop.
This marks the sixth straight year the Northeast has retained the most dairy farms among all regions. Pennsylvania stands second in herd numbers following Wisconsin's 10,290 dairy farms and bucked the national trend by adding 170 dairy farms to bring its total to 7,370 operations. All other states remained steady or realized a reduction in dairy farm numbers.