The author is with the University of Wisconsin Center for Dairy Profitability and is a professor of agribusiness at the University of Wisconsin-Platteville.
Agriculture is cyclical on many levels . . . whether it is the seasons of the year, animal gestation, or even economics.
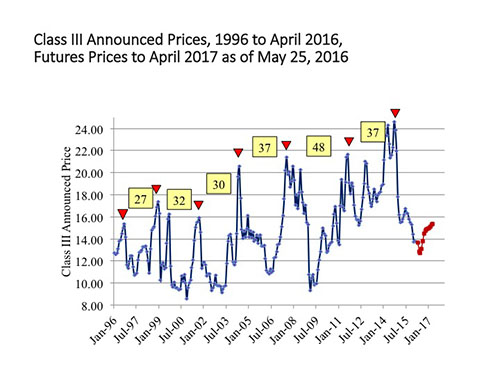
From the economic front, the chart below details the cyclical nature of Class III or equivalent milk prices since 1996. The red triangles show major price peaks and how many months until the next peak.
The Class III price cycles to a new peak about every 28 to 42 months. The last peak was September 2014. Following historical logic, that means a good chance of the next peak being sometime between January 2017 and March 2018.
When margins are tight the goal is often "making it" through without undue disruption of the operation. The road map for doing so is cash flow.
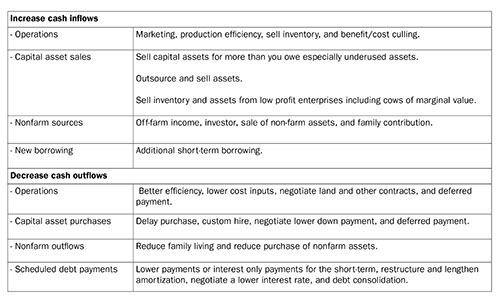
Cash flow is not a measure of profitability, it is simply the planning for and accounting of incoming cash being greater than outgoing cash. The table below lists ideas for boosting cash inflows and reducing outflows. Be sure to plan carefully such that you don't trigger future problems with operations or tax consequences.
To comment, email your remarks to intel@hoards.com.
(c) Hoard's Dairyman Intel 2016
May 30, 2016
Agriculture is cyclical on many levels . . . whether it is the seasons of the year, animal gestation, or even economics.
From the economic front, the chart below details the cyclical nature of Class III or equivalent milk prices since 1996. The red triangles show major price peaks and how many months until the next peak.
The Class III price cycles to a new peak about every 28 to 42 months. The last peak was September 2014. Following historical logic, that means a good chance of the next peak being sometime between January 2017 and March 2018.
When margins are tight the goal is often "making it" through without undue disruption of the operation. The road map for doing so is cash flow.
Cash flow is not a measure of profitability, it is simply the planning for and accounting of incoming cash being greater than outgoing cash. The table below lists ideas for boosting cash inflows and reducing outflows. Be sure to plan carefully such that you don't trigger future problems with operations or tax consequences.
(c) Hoard's Dairyman Intel 2016
May 30, 2016