As printed in our February 25, 2017 issue . . .
USDA ECONOMISTS RECONFIRMED their All-Milk price forecast for the year at $18.05, up just a nickel from January. Range was from $17.70 to $18.40. CME Class III March to December future contracts mirrored those projections with a $17.50 average and a $17 to $18 range.
AT $10.54 PER CWT., MARGINS IMPROVED in November and December to the highest levels since the inception of the Margin Protection Program (MPP-Dairy). The two-month prices averaged: $18.20 milk; $130 per ton hay; $3.28 per bushel corn; and $322 per ton soybean meal.
THE STATUS OF CALIFORNIA’S FEDERAL ORDER remains uncertain. USDA officials had signed off on a preliminary decision and submitted documents for publication in the Federal Register for official dissemination prior to President Trump’s inauguration. According to sources, that document was not published and has since been pulled back by USDA.
HISTORICALLY HIGH HEIFER INVENTORIES remain despite a 64,000-head reduction over the past year. In January, there were 4.75 million head (500 pounds or larger) or 50.9 heifers per 100 cows. That ratio was down from last year’s 51.8, the highest since the mid-1980s
SOON-TO-CALVE REPLACEMENTS NETTED $1,620. That was down $210 in the past 12 months. Nationally, prices ranged from highs of $1,850 in New Mexico and $1,800 in Colorado down to $1,470 in Virginia.
MILK PRODUCTION CLIMBED 1.9 PERCENT throughout 2016 to reach 212.5 billion pounds. Milk per cow averaged 22,770, up 1.7 percent. Both were new records. Cow numbers rose 0.2 percent to 9.3 million.
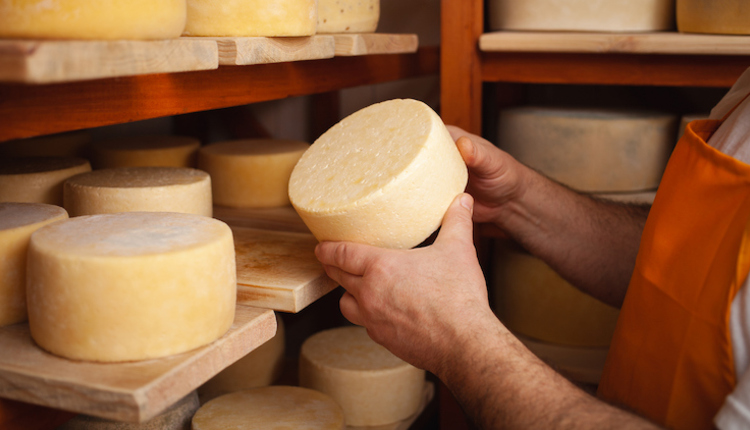
FOR THE 25TH STRAIGHT YEAR, cheese output posted a new record. In 2016, production grew 2 percent to pass the 12 billion-pound plateau. Since 1990, cheese output has doubled from 6 to 12 billion pounds.
BUTTER PUSHED PAST THE ALL-TIME RECORD set in 1941. Last year, manufacturers produced 1.89 billion pounds of butter. That also made 2016 the fifth straight year that butter output topped 1.8 billion.
CLASS I OR FLUID USE across all federal orders fell to 31 percent last year. Class II (yogurt and soft products) held at 14 percent. Meanwhile, Class III (cheese) soaked up fluid’s share by climbing 2 percent to reach 42 percent. Class IV (butter and dry products) also held steady at 14 percent.
U.S. DAIRY EXPORTS FINISHED DECEMBER up 15 percent when compared to the same time last year. On a total milk solids basis, shipments were equivalent to 14.5 percent of U.S. milk production.
A PLAN TO TEST FOR TETRACYCLINE residues likely will be delayed by the Food and Drug Administration. Originally slated as a pilot program this spring, the FDA has yet to approve the necessary tests for the project.
In your next issue!
PROTEIN INTAKE AND NITROGEN EFFICIENCY GO HAND IN HAND.
Finding the right ration inclusion rates and types of protein can enable you to properly manage nitrogen efficiency.
STRENGTHEN YOUR FIGHT AGAINST BVD.
Biosecurity, testing, and vaccination all help keep bovine viral diarrhea (BVD) under control.
TEETERING BETWEEN FARMING GOALS AND FAMILY VALUES.
A family farm unavoidably mixes family with business . . . is it possible to meet the needs of both?


