A year ago, the combined milk output in the key exporting regions — Argentina, Brazil, the European Union (EU), Oceania, and the United States — trailed the prior year. By the spring of 2017, year-over-year (YOY) growth in milk output turned positive. This represents a relatively new trend.
Unlike its global competitors, the United States has recorded greater YOY growth for every month since December 2013. Most recently, the United States posted a 2 percent YOY gain in milk production over August 2016, which matched July’s YOY gain.
Greater YOY milk production was driven by a 1.2 percent gain in milk per cow and a 0.8 percent or 71,000-head gain in the U.S. dairy herd. At 9.405 million head, the U.S. dairy herd stands near a 20-year high.
More potential milk
European milk production during 2017’s third quarter is expected to surpass the prior year by 2 percent, with larger YOY gains expected in the fourth quarter. Keep in mind that European milk output during 2016’s fourth quarter and 2017’s first quarter was stunted by low milk prices and a financial incentive, sponsored by the EU government. In some cases, the incentives were even enhanced by local cooperatives as a means for producers to reduce milk output compared to the prior year.
That means European dairy farmers will be spurred on by significantly higher milk prices in the fourth quarter of 2017. During the third quarter of 2017, EU milk prices surpassed the prior year by 30 percent, and 40 percent YOY gains are expected in quarter four. Even so, it might be difficult for Europe to offset all of last year’s fourth quarter YOY reduction of 3.5 percent, due to variability in feed quality, but the financial incentive to do so will be there.
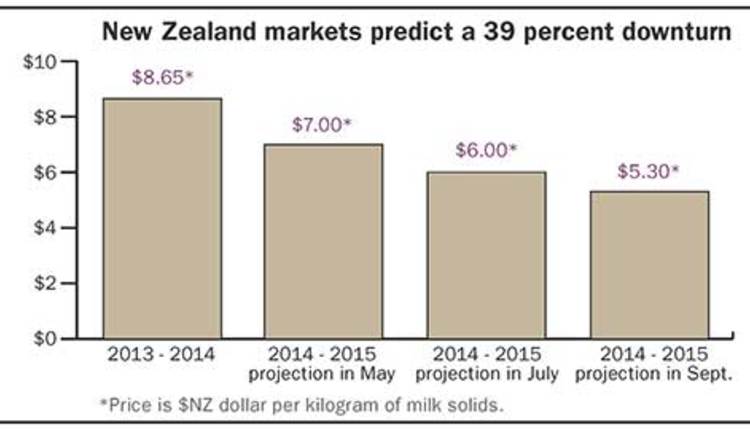
Oceania milk producers are also the benefactors of higher milk prices compared to the prior season. Year-over-year production gains from this region are expected to exceed 3 percent. However, growth could be double that if milk prices remain steady and weather conditions are favorable.
The same is true for Argentina and Brazil. In other words, each of the key milk production regions around the globe are poised to produce more milk in the upcoming year.
More competition
U.S. dairy export volumes were disappointing in July and may foreshadow stiffer competition. After 12 consecutive months of growth, exports were down 1 percent from a year ago, the lowest since January, and off 9 percent from June (on a daily average basis). Foreign sales of nonfat dry milk (NDM) and skim milk powder (SMP) totaled 43,232 tons, down 13 percent from last year, and the first YOY decline since June 2016.
Exports to the United States largest NDM/SMP market, Mexico, were up just 1 percent. Perhaps more concerning is that both Canada and the EU reported greater YOY gains in NDM/SMP sales to Mexico.
Dairy at home
On the domestic side of the equation, 2016 data recently released by USDA shows that per capita consumption of dairy products in the United States set a new record at 646 pounds, up 2.6 percent from the prior year. Improved dairy product consumption was driven by enhanced cheese and butter demand.
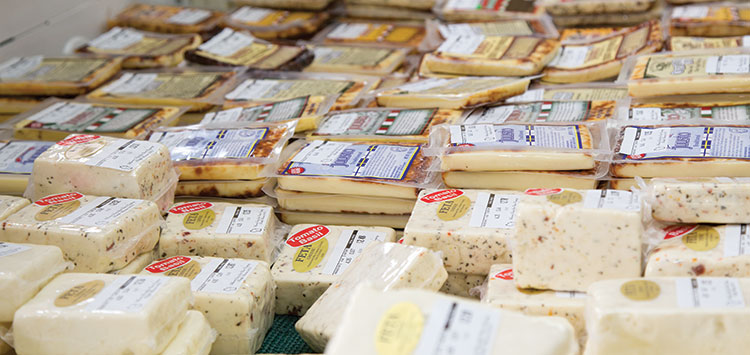
Per capita cheese consumption was record high at 36.3 pounds per person. Cheese demand grew by 1.26 pounds in 2016, the highest YOY gain since 1999, due to greater demand for both American and non-American style cheeses. Per capita consumption of American cheese improved by 0.3 pound to 14.3 pounds, while consumption of non-American style cheese rose by 0.9 pound to 22 pounds per person. Per capita growth in non-American cheese has risen steadily since the early 1970s.
At that time, per capita consumption of American cheese totaled 7 pounds while demand for non-American cheese averaged just 4.4 pounds. In 1988, non-American cheese consumption at 12.2 pounds per person surpassed American cheese demand for the first time, which averaged 11.5 pounds.
Since then, per capita consumption of non-American cheese has nearly doubled, while American cheese consumption has crept modestly higher.
Butter consumption continues to grow under a perceived healthier halo. In 2016, U.S. per capita butter consumption topped 5.7 pounds per person, up 1.7 percent from 2015, and the highest level in more than 45 years.
Higher fat milk
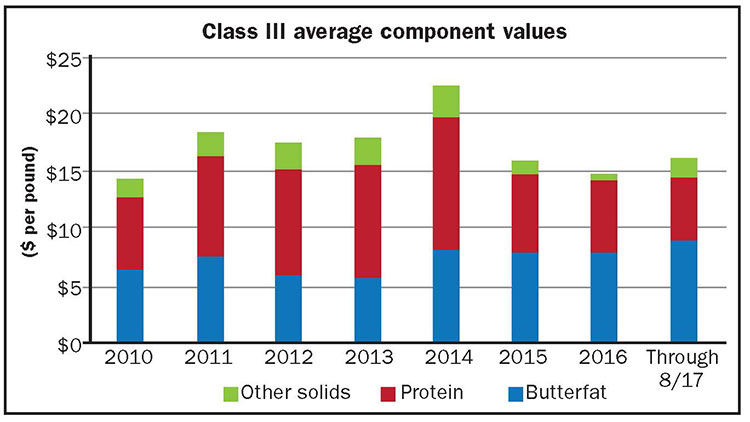
Greater cheese and butter demand, along with rising consumption of whole milk, requires more butterfat production. U.S. dairy farmers have responded to the market signals to produce milk containing more butterfat. Since 2010, the average annual butterfat content has improved from 3.66 percent to 3.79 percent in 2016.
The importance of butterfat should not be overlooked. Year-to-date U.S. farmgate milk prices and dairy producer profitability would be lower if it were not for higher YOY butter prices. CME cash butter prices are on track to exceed more than $2 per pound in every trading session of 2017. If it occurs, it will be a first.
The contribution of butterfat in the Class III milk price topped 67 percent and 64 percent, respectively, in July and August 2017. Despite a retreat in CME cash butter prices during the third quarter of 2017, additional price gains are likely during the fourth quarter, due to seasonality and a tight global butterfat market.
Also, keep your eye on Russia.
Since imposing a ban on dairy products in August 2014 from several countries, including the European Union, the United States, and Canada, Russia has imported most of its butterfat from Belarus. Year to date, Belarus accounts for 65 percent of Russia’s butterfat imports, down from 75 percent from the same period last year due to Russian “imposed trade restrictions” on some Belarusian dairy production facilities, according to USDA. As a result, Russia is importing more butterfat from New Zealand.
Through the first half of 2017, Russia imported 31.1 million pounds of butterfat from New Zealand, equal to all imports for 2016, more than the 13.5 million pounds imported in 2015, and on pace to exceed 2014 levels and to set an all-time high. USDA forecasts that Russia’s butter consumption could rise to 363,000 metric tons (MT), up 31,000 MT, or 68 million pounds more than last year, which translates to a 50- to 60-million-pound jump in Russia’s butterfat imports. Through June, Russia is on track to meet USDA’s forecast.
The potential for a 30-million-pound YOY increase in Russia’s butterfat imports during the second half of 2017 bodes well for New Zealand butterfat exports, especially during Oceania’s peak production period. It could also keep world butter prices high until seasonal demand eases and butter production increases in the Northern Hemisphere.