The author is a market commentator and editor of the Daily Dairy Report.
Dairy industry veterans have long memories. Many in our industry have weathered a number of economic storms that took place in 2002, 2006, 2009 and now 2012. Whether comparing income-over-feed costs or using the Milk-Feed-Price Ratio, farm gate profitability has contracted up in each of these downturns.
USDA's Milk-Feed-Price Ratio represents the pounds of 16-percent mixed dairy feed equal in value to 1 pound of milk at test. The mixed-feed ration consists of 51 percent corn, 41 percent alfalfa hay and 8 percent soybeans. USDA uses the national average prices received by farmers for those commodities as well as the national All-Milk Price to derive the Milk-Feed-Price Ratio.
The latest milk-feed ratio available at press time was the preliminary August 2012 ratio of 1.35, one of the lowest in history and 0.12 less than the previous lowest monthly milk-feed ratio of 1.47, experienced in 2009, which was arguably the worst year for dairy farm profitability until now.
A double expansion
As with any comparisons, there are similarities and differences. The primary similarity is that profit margins are extremely tight for both years, and the shrinking margins follow a long period of sustained growth in the U.S. dairy herd and strong dairy product exports.
For example, the U.S. dairy herd expanded in every month between February 2007 when the nation's dairy herd stood at 9.1445 million head and July 2008 when it hit 9.334 million. In other words, the dairy herd expanded by 187,000 head over 17 months. Likewise, the dairy herd had grown from 9.125 million head in August 2010 to 9.271 million head in April 2012, a 146,000-head gain over 20 months.
Low pay was the culprit
There are two key differences between 2009 and now. The 2009 downturn was driven by exceptionally low milk prices and a significant reduction in exports. During the first half of 2009, the California mailbox milk price averaged less than $10 per hundredweight, and exports of nonfat dry milk/skim milk powder (NDM/SMP) totaled 240 million pounds, down 54 percent versus 2008.
In 2012, the California mailbox milk price averaged $15.03 through May 2012, and NDM/SMP exports totaled 533 million pounds, up almost 11 percent versus the prior year. Despite unprecedented growth in U.S. and global milk production during the second half of 2011 and into 2012, global dairy product prices did not collapse as worldwide demand continued to grow.
This time it is about feed
Clearly, rising feed costs drive the key difference in this margin squeeze versus 2009. Each of the commodity prices used to calculate USDA's latest Milk-Feed-Price Ratio are at record highs. The national average price received for corn in August is $7.54 per bushel, up 40 cents versus the prior month; soybeans at $15.90 per bushel are up 50 cents; and alfalfa hay at $203 per ton is $5 higher.
Unfortunately, it is unlikely that these feed costs will fall significantly over the next 12 months. As a result, dairy producers who purchase a significant portion of their feedstuffs will most likely face a greater margin squeeze than their counterparts who raise their own feed. However, many dairy producers with significant crop acreage faced the worst drought in half a century. As a result, the competition for feed, particularly forage, is expected to be keen in coming months, and rationing of supply is expected.
Rationing of the feed supply typically entails feeding less expensive rations and culling. Since May 2012, the U.S. dairy herd has contracted by 44,000 head, and it is likely that the American dairy herd will drop 100,000 cows by this January compared to the same time a year earlier. This means that, even if milk per cow is unchanged, U.S. milk output will be down 1.1 percent due to the drop in cow numbers alone.
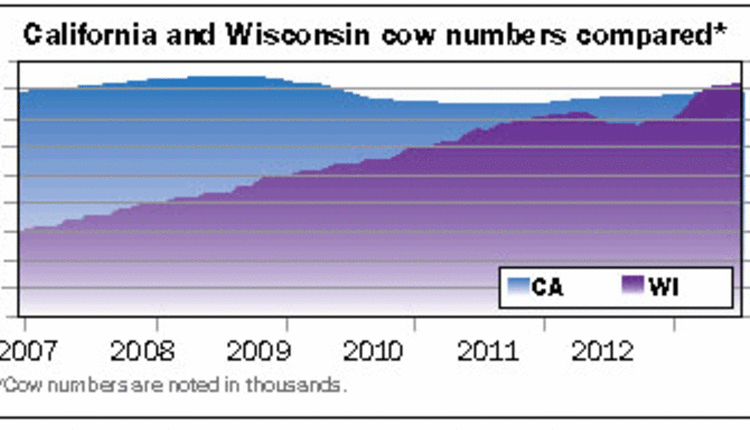
During the 2009 margin squeeze, the California dairy herd, the largest in the nation, fell from 1.832 million cows in January 2009 to 1.76 million head one year later. The 72,000-head decline in California's herd accounted for nearly one-third of the drop in the U.S. dairy herd during that period. Conversely, the Wisconsin dairy herd, the nation's second largest, rose 5,000 head from 1.255 million to 1.26 million (see table). Looking forward, the California herd is once again expected to feel the brunt of this year's herd contraction. At the same time, the Wisconsin herd likely will not go unscathed as feed and forage availability will be an issue for dairy producers in the state's southern region.
Better days ahead
Dairy producers who weather the 2012 economic storm are likely to experience a brighter 2013. Based on a 1.1-percent correction in the U.S. dairy herd, and lower milk per cow versus 2012's record first quarter growth of 3 percent, U.S. milk production could easily be down 2 to 4 percent in 2013's first quarter versus the prior year.
Lower U.S. milk production does not guarantee record-high milk prices for 2013. Our forecast calls for unchanged growth in New Zealand milk production after last year's more than 10-percent gain. Milk production in the European Union is expected to rise less than 1 percent. Based on these assumptions, a Class III price above $19 per hundredweight and a Class IV price over $17.50 are likely for the first half of 2013.
Dairy industry veterans have long memories. Many in our industry have weathered a number of economic storms that took place in 2002, 2006, 2009 and now 2012. Whether comparing income-over-feed costs or using the Milk-Feed-Price Ratio, farm gate profitability has contracted up in each of these downturns.
USDA's Milk-Feed-Price Ratio represents the pounds of 16-percent mixed dairy feed equal in value to 1 pound of milk at test. The mixed-feed ration consists of 51 percent corn, 41 percent alfalfa hay and 8 percent soybeans. USDA uses the national average prices received by farmers for those commodities as well as the national All-Milk Price to derive the Milk-Feed-Price Ratio.
The latest milk-feed ratio available at press time was the preliminary August 2012 ratio of 1.35, one of the lowest in history and 0.12 less than the previous lowest monthly milk-feed ratio of 1.47, experienced in 2009, which was arguably the worst year for dairy farm profitability until now.
A double expansion
As with any comparisons, there are similarities and differences. The primary similarity is that profit margins are extremely tight for both years, and the shrinking margins follow a long period of sustained growth in the U.S. dairy herd and strong dairy product exports.
For example, the U.S. dairy herd expanded in every month between February 2007 when the nation's dairy herd stood at 9.1445 million head and July 2008 when it hit 9.334 million. In other words, the dairy herd expanded by 187,000 head over 17 months. Likewise, the dairy herd had grown from 9.125 million head in August 2010 to 9.271 million head in April 2012, a 146,000-head gain over 20 months.
Low pay was the culprit
There are two key differences between 2009 and now. The 2009 downturn was driven by exceptionally low milk prices and a significant reduction in exports. During the first half of 2009, the California mailbox milk price averaged less than $10 per hundredweight, and exports of nonfat dry milk/skim milk powder (NDM/SMP) totaled 240 million pounds, down 54 percent versus 2008.
In 2012, the California mailbox milk price averaged $15.03 through May 2012, and NDM/SMP exports totaled 533 million pounds, up almost 11 percent versus the prior year. Despite unprecedented growth in U.S. and global milk production during the second half of 2011 and into 2012, global dairy product prices did not collapse as worldwide demand continued to grow.

This time it is about feed
Clearly, rising feed costs drive the key difference in this margin squeeze versus 2009. Each of the commodity prices used to calculate USDA's latest Milk-Feed-Price Ratio are at record highs. The national average price received for corn in August is $7.54 per bushel, up 40 cents versus the prior month; soybeans at $15.90 per bushel are up 50 cents; and alfalfa hay at $203 per ton is $5 higher.
Unfortunately, it is unlikely that these feed costs will fall significantly over the next 12 months. As a result, dairy producers who purchase a significant portion of their feedstuffs will most likely face a greater margin squeeze than their counterparts who raise their own feed. However, many dairy producers with significant crop acreage faced the worst drought in half a century. As a result, the competition for feed, particularly forage, is expected to be keen in coming months, and rationing of supply is expected.
Rationing of the feed supply typically entails feeding less expensive rations and culling. Since May 2012, the U.S. dairy herd has contracted by 44,000 head, and it is likely that the American dairy herd will drop 100,000 cows by this January compared to the same time a year earlier. This means that, even if milk per cow is unchanged, U.S. milk output will be down 1.1 percent due to the drop in cow numbers alone.
During the 2009 margin squeeze, the California dairy herd, the largest in the nation, fell from 1.832 million cows in January 2009 to 1.76 million head one year later. The 72,000-head decline in California's herd accounted for nearly one-third of the drop in the U.S. dairy herd during that period. Conversely, the Wisconsin dairy herd, the nation's second largest, rose 5,000 head from 1.255 million to 1.26 million (see table). Looking forward, the California herd is once again expected to feel the brunt of this year's herd contraction. At the same time, the Wisconsin herd likely will not go unscathed as feed and forage availability will be an issue for dairy producers in the state's southern region.
Better days ahead
Dairy producers who weather the 2012 economic storm are likely to experience a brighter 2013. Based on a 1.1-percent correction in the U.S. dairy herd, and lower milk per cow versus 2012's record first quarter growth of 3 percent, U.S. milk production could easily be down 2 to 4 percent in 2013's first quarter versus the prior year.
Lower U.S. milk production does not guarantee record-high milk prices for 2013. Our forecast calls for unchanged growth in New Zealand milk production after last year's more than 10-percent gain. Milk production in the European Union is expected to rise less than 1 percent. Based on these assumptions, a Class III price above $19 per hundredweight and a Class IV price over $17.50 are likely for the first half of 2013.
This article appears on page 645 of the October 10, 2012 issue of Hoard's Dairyman.
