The author is a professor in the department of agricultural and applied economics at the University of Wisconsin-Madison.
The dramatic upward runs in grain prices over the last 18 months have hampered the ability of U.S. dairy producers to generate adequate returns on milk production. For those producers with a greater dependence on purchased feed, the situation is even more dire. Such is the case in California, but the reason goes beyond heavy reliance on purchased feed. The Golden State's unique state pricing order that establishes minimum milk prices is also having an impact on producer net returns.
Pricing under two systems
Wisconsin dairy farms market their milk under the minimum pricing rules established by the Federal Milk Marketing Order (FMMO) system. Its foundation is classified pricing which places value on the products specifically made from that milk. In contrast to Federal Orders, California has its own classified pricing system with five classes.
The California milk pricing system, like the FMMOs, values milk depending on end use. Although they are similar in underlying philosophy, the specific provisions found in these two pricing systems result in significantly different milk values. Recently, these differences have become a major dairy policy concern in California as an ongoing debate is taking place between dairy producers and processors. The concern is so great that some producer groups within California are investigating establishing an FMMO.
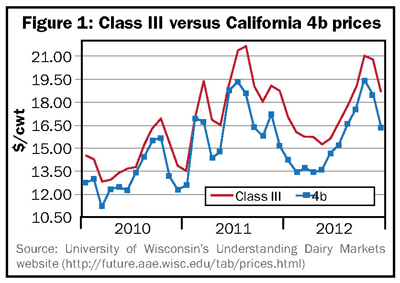
As an example, in Figure 1 we show the minimum value for milk used in manufacturing cheese as expressed in $ per hundredweight (cwt.). From January 2010 to December 2012, the average (FMMO Class III - California 4b) milk price difference was $1.72 per cwt. This represented more than a 10 percent spread observed over the two-and-a-half-plus-year period of Class III prices.
Before we dig into this difference, let's take a quick refresher on mailbox pricing. A producer's mailbox price is the value of the milk produced where this value includes all bonuses due to quality, other over-order premiums and producer price differential payments, minus any deductions such as milk-related transportation costs, check-off contributions, plant testing fees and so forth.
Besides differences in milk pricing systems, another reason for the different mailbox prices when comparing Wisconsin and California stem from variation in end use or product utilization of the state's milk. In 2011, more than 82 percent of the milk produced in the Upper Midwest FMMO (which includes Wisconsin) was used for Class III purposes, mainly cheese. In comparison, less than 45 percent of California's milk went to manufacturing cheese. More than a third of California milk went towards nonfat dry milk (NFDM) and butter compared to less than 2 percent in the Upper Midwest.
This is an important consideration when determining each producer's overall mailbox prices. Milk used for manufacturing butter and powder tends to have a lower payout than milk used in cheese manufacturing. This almost always holds true, although there have been times when the minimum price for milk used in cheese manufacturing has been less than the minimum price for dry dairy products.
The combined effect of different pricing structures and milk utilization in these two states is quite profound. The average Wisconsin mailbox prices have been higher than California values for some time. However, the spread is growing. From January 2010 to September 2012 (the most recent data available at this writing), the average (Wisconsin-California) mailbox basis was $2.12. That number only tells a portion of the story. In 2010, the average basis was $1.61 compared to $2.82 over the first nine months of 2012.
Variation in feed costs
Due to much larger dairy farm sizes in California (1,056 cows), a higher portion of feed must be purchased relative to the typical Wisconsin dairy farm (105 cows). Another contributing factor to higher feed costs is the varied competition for land among the many crops grown in California. To compare cost structures, we will use the formulas that were found in the November 2012 U.S. House of Representatives' version of the proposed 2012 Farm Bill. The bill's dairy feed ration contains not only the feed required directly by the milking herd, but needs replacement heifers, dry cows and hospital cows. Assuming that all feed is purchased on prevailing local feed prices (Wisconsin and California), we can compare representative feed costs on a $ per cwt. of milk basis from 2010 to 2012.
In contrast to the pattern observed with respect to mailbox prices, the average California feed cost profile was significantly higher than Wisconsin. In 2010, the average California cost to feed the entire herd was 27 percent greater than Wisconsin. In 2011, this percentage jumped to 39 percent and then we estimate it fell to 28.5 percent in 2012.
These comparisons highlight the fact that feed costs differ across region and thus have differing impacts on the ability to generate positive margins. For this exercise it should be noted that feed cost values for both California and Wisconsin are on the high side given the implicit assumption that all feed is purchased and we are feeding the entire herd.
Using estimated mailbox prices and feed costs, we can generate average income over feed cost (IOFC) estimates. The IOFC measure can help us determine the variable production costs associated based on fluctuations in feed.
Less room for error
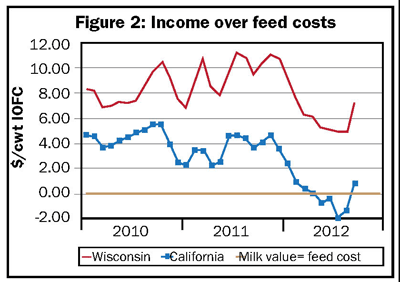
Since 2010, we found that the estimated California IOFC is significantly less than the Wisconsin value . . . meaning there is less margin in selling milk. Figure 2 displays three IOFC estimates, one for Wisconsin, one for California and the level where IOFC is zero. For 2010, our estimated Wisconsin IOFC was $8.14 per cwt. compared to $4.39 per cwt. for California - a $3.75 difference. In 2011, the average Wisconsin IOFC climbed to $9.63 per cwt., while the California IOFC fell to $3.61 per cwt. From January to September 2012, the average California IOFC was at a break-even level compared to $6.24 for an average Wisconsin operation.
While improved feed costs and pay prices would benefit all producers, it should be noted that even with a positive IOFC, the ability to cover all of an operation's production costs are not guaranteed. This is the case even with $16.26 and $19 mailbox prices, our forecast of the average 2012 California and Wisconsin mailbox prices, respectively.
The dramatic upward runs in grain prices over the last 18 months have hampered the ability of U.S. dairy producers to generate adequate returns on milk production. For those producers with a greater dependence on purchased feed, the situation is even more dire. Such is the case in California, but the reason goes beyond heavy reliance on purchased feed. The Golden State's unique state pricing order that establishes minimum milk prices is also having an impact on producer net returns.
Pricing under two systems
Wisconsin dairy farms market their milk under the minimum pricing rules established by the Federal Milk Marketing Order (FMMO) system. Its foundation is classified pricing which places value on the products specifically made from that milk. In contrast to Federal Orders, California has its own classified pricing system with five classes.
The California milk pricing system, like the FMMOs, values milk depending on end use. Although they are similar in underlying philosophy, the specific provisions found in these two pricing systems result in significantly different milk values. Recently, these differences have become a major dairy policy concern in California as an ongoing debate is taking place between dairy producers and processors. The concern is so great that some producer groups within California are investigating establishing an FMMO.
As an example, in Figure 1 we show the minimum value for milk used in manufacturing cheese as expressed in $ per hundredweight (cwt.). From January 2010 to December 2012, the average (FMMO Class III - California 4b) milk price difference was $1.72 per cwt. This represented more than a 10 percent spread observed over the two-and-a-half-plus-year period of Class III prices.
Before we dig into this difference, let's take a quick refresher on mailbox pricing. A producer's mailbox price is the value of the milk produced where this value includes all bonuses due to quality, other over-order premiums and producer price differential payments, minus any deductions such as milk-related transportation costs, check-off contributions, plant testing fees and so forth.
Besides differences in milk pricing systems, another reason for the different mailbox prices when comparing Wisconsin and California stem from variation in end use or product utilization of the state's milk. In 2011, more than 82 percent of the milk produced in the Upper Midwest FMMO (which includes Wisconsin) was used for Class III purposes, mainly cheese. In comparison, less than 45 percent of California's milk went to manufacturing cheese. More than a third of California milk went towards nonfat dry milk (NFDM) and butter compared to less than 2 percent in the Upper Midwest.
This is an important consideration when determining each producer's overall mailbox prices. Milk used for manufacturing butter and powder tends to have a lower payout than milk used in cheese manufacturing. This almost always holds true, although there have been times when the minimum price for milk used in cheese manufacturing has been less than the minimum price for dry dairy products.
The combined effect of different pricing structures and milk utilization in these two states is quite profound. The average Wisconsin mailbox prices have been higher than California values for some time. However, the spread is growing. From January 2010 to September 2012 (the most recent data available at this writing), the average (Wisconsin-California) mailbox basis was $2.12. That number only tells a portion of the story. In 2010, the average basis was $1.61 compared to $2.82 over the first nine months of 2012.
Variation in feed costs
Due to much larger dairy farm sizes in California (1,056 cows), a higher portion of feed must be purchased relative to the typical Wisconsin dairy farm (105 cows). Another contributing factor to higher feed costs is the varied competition for land among the many crops grown in California. To compare cost structures, we will use the formulas that were found in the November 2012 U.S. House of Representatives' version of the proposed 2012 Farm Bill. The bill's dairy feed ration contains not only the feed required directly by the milking herd, but needs replacement heifers, dry cows and hospital cows. Assuming that all feed is purchased on prevailing local feed prices (Wisconsin and California), we can compare representative feed costs on a $ per cwt. of milk basis from 2010 to 2012.
In contrast to the pattern observed with respect to mailbox prices, the average California feed cost profile was significantly higher than Wisconsin. In 2010, the average California cost to feed the entire herd was 27 percent greater than Wisconsin. In 2011, this percentage jumped to 39 percent and then we estimate it fell to 28.5 percent in 2012.
These comparisons highlight the fact that feed costs differ across region and thus have differing impacts on the ability to generate positive margins. For this exercise it should be noted that feed cost values for both California and Wisconsin are on the high side given the implicit assumption that all feed is purchased and we are feeding the entire herd.
Using estimated mailbox prices and feed costs, we can generate average income over feed cost (IOFC) estimates. The IOFC measure can help us determine the variable production costs associated based on fluctuations in feed.
Less room for error
Since 2010, we found that the estimated California IOFC is significantly less than the Wisconsin value . . . meaning there is less margin in selling milk. Figure 2 displays three IOFC estimates, one for Wisconsin, one for California and the level where IOFC is zero. For 2010, our estimated Wisconsin IOFC was $8.14 per cwt. compared to $4.39 per cwt. for California - a $3.75 difference. In 2011, the average Wisconsin IOFC climbed to $9.63 per cwt., while the California IOFC fell to $3.61 per cwt. From January to September 2012, the average California IOFC was at a break-even level compared to $6.24 for an average Wisconsin operation.
While improved feed costs and pay prices would benefit all producers, it should be noted that even with a positive IOFC, the ability to cover all of an operation's production costs are not guaranteed. This is the case even with $16.26 and $19 mailbox prices, our forecast of the average 2012 California and Wisconsin mailbox prices, respectively.