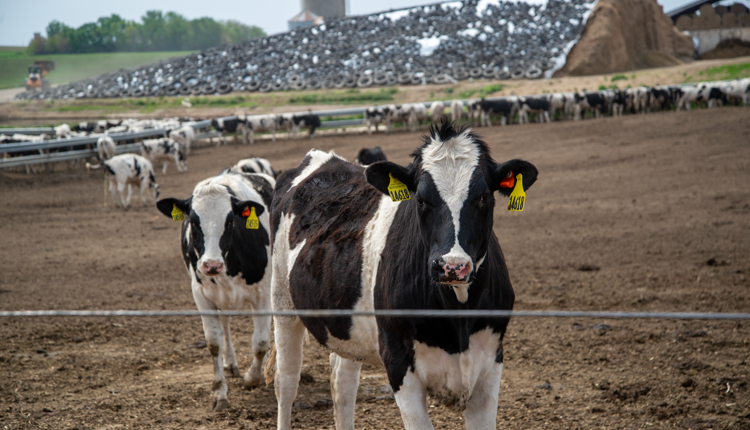
Tight margins that ranged from $5.76 to $9.17 per hundredweight after feed costs were among the reasons that 1,725 dairy farmers exited the industry last year. Those business closings were only the fourth time in the past decade that 4 percent or more of dairy farmers left the industry.
It goes without saying that dairy cows and farms continue to consolidate into clusters. When evaluating the top 10 dairy states as measured by total dairy farms, that group only lost 3.7 percent of its farms last year. Each state in that group also had 1,000 or more dairy farms. For the remaining 40 states, losses totaled a more brisk 4.9 percent.
In reviewing the prior year’s report, USDA shaved 50 herds off of its 2015 estimate, reducing the total from 43,584 to 43,534. In the updated data shown to the right, California had 25 fewer herds; Utah, fell by 20; New York dropped 10; and South Carolina declined 5. Meanwhile, Maine had 10 more herds.
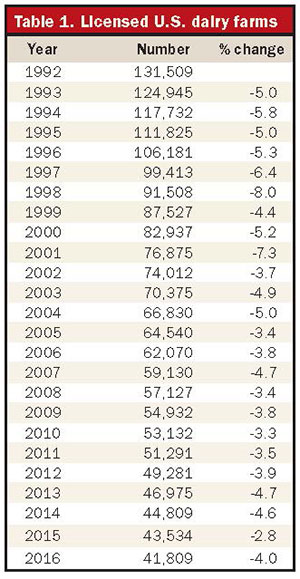
Table 1 details the 25-year history of dairy farms holding permits to sell milk. Since 1992, the drop in licensed, or so-called commercial, dairy farms has declined 89,700 from 131,509 to 41,809. That’s a 68 percent drop during that time.
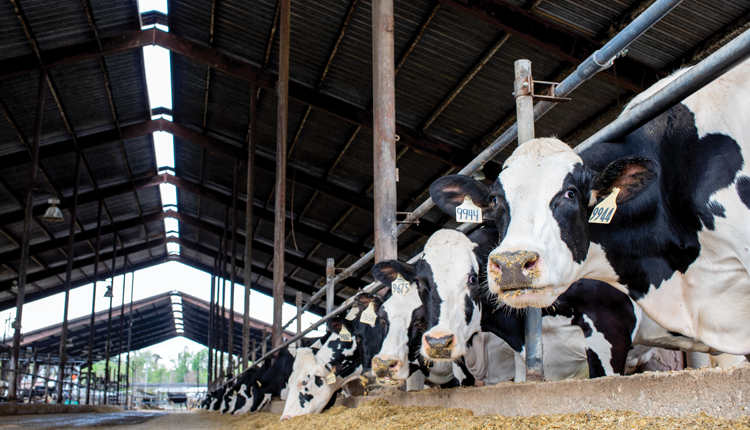
Table 2 provides a collective overview of the last 25 years of change. Nationally, average herd size has grown 203 percent, from 74 to 223 cows. Regionally, the West (+314) and the Midwest (+194) have seen the largest percentage gains in herd size. During that time, herd sizes in the Northeast and Southwest grew at half that pace.
Western herds added 34 cows per herd last year, bringing its average to 1,089. That represented stronger growth in herd size compared to the prior year’s 16 cows. Even so, the higher 34-cow total remained off the pace of 2012 to 2014 when herd sizes grew 49, 33, and 47 cows, respectively.
Meanwhile, the Southeast (+10) added one more cow to its average herd while the Midwest matched the national average. After moving into triple-digit herd numbers for the first time last year, Northeast herds inched up herd numbers by three to reach 107 cows per herd as shown in Table 2.
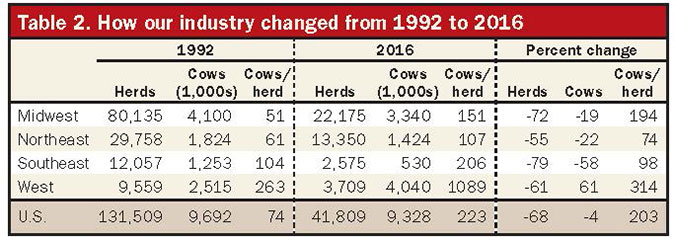
For the twelfth time in the past 14 years, the Southeast had the largest share of farms calling it quits this past year (Table 3). The 7.4 percent total yielded 205 fewer dairy farms. That percentage reduction was the largest since to the 8.8 percent reduction in 2007. Since 1992, the Southeast has lost more operations than any other area as farms fell from 12,057 to 2,575 . . . a drop of 9,482 farms or 79 percent. Cow numbers followed suit; there are 723,000 fewer cows, a 58 percent drop.
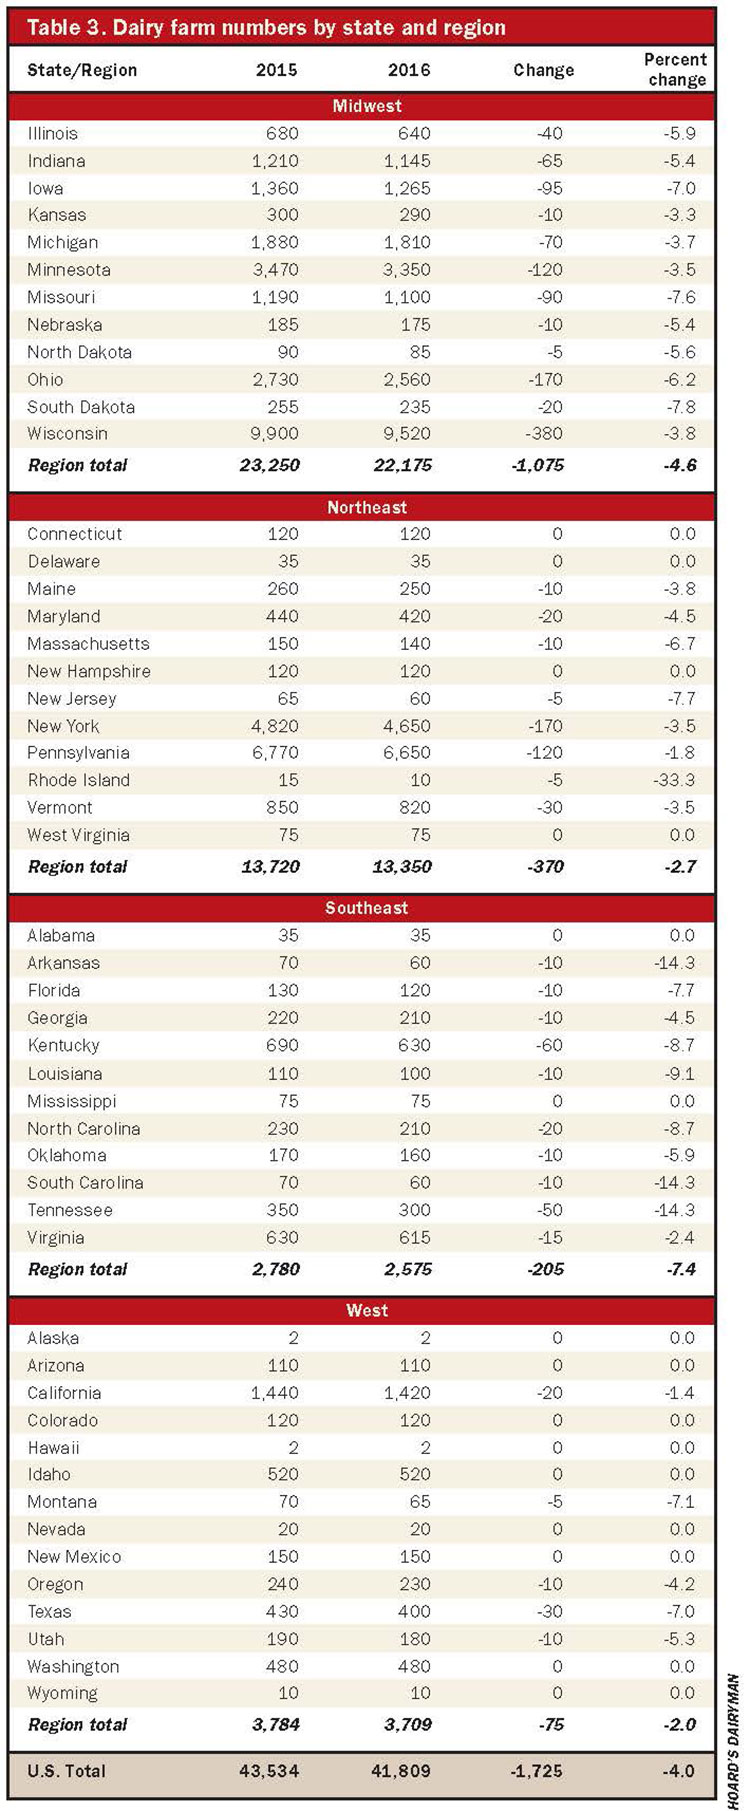
Next was the Midwest, which lost 4.6 percent of its dairy operations. Outside of the Southeast, the Midwest has been the only other region to post the largest reduction in dairy farms. The Midwest lost the most dairies in 2011 and 2014. Overall, its 4.6 percent reduction in farm numbers was the most since 2014. Within the region, Wisconsin lost 380 dairy farms, making that the largest loss in the region. However, on a percentage basis, the Badger State bucked recent trends by being under the regional and national average at 3.8 percent.
For back-to-back years, the West retained the most dairy farms among all regions. Previous to this, the Northeast had retained the most operations for six straight years.
This article appears on page 537 of the February 25, 2017 issue of Hoard's Dairyman.