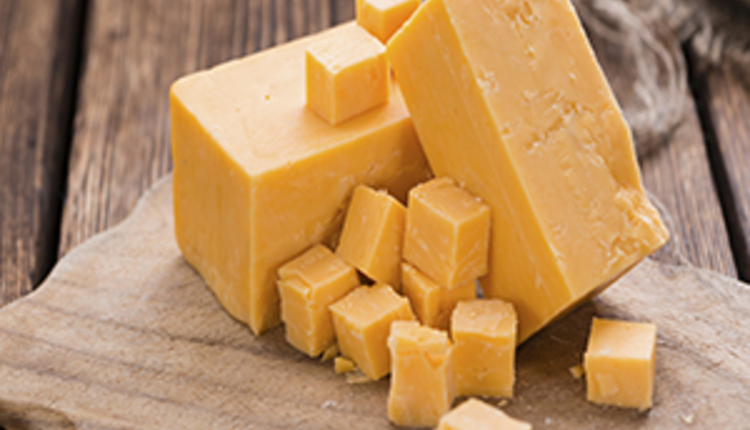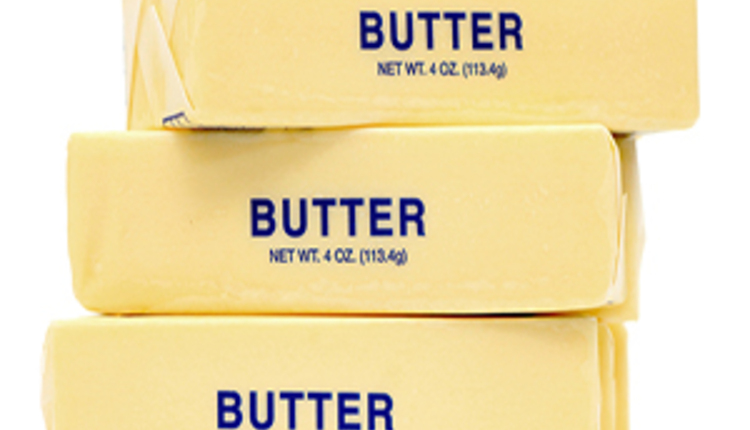
From 2000 to 2018, milkfat levels in the collective U.S. bulk tank jumped from 3.68 to 3.89 percent. With both climbing milkfat percentages and climbing milk production, two dairy products continued to absorb more and more milkfat — cheese and butter.
When measured by product need (as a percentage of the milkfat supply), cheese and butter absorbed a greater share of the U.S. milk supply with each passing year:
- 54 percent in 2000 (cheese 37.7 percent and butter 16.3 percent)
- 60.4 percent in 2017 (cheese 42.5 percent and butter 17.9 percent)
An impressive feat
Cheese and butter's contribution to dairy product sales becomes even more impressive when one takes a deeper look into the national trends. These additional cheese and butter sales took place even as the U.S. dairy industry produced 2.3 million more pounds of butterfat during that 18-year stretch. Put another way, U.S. milk (as measured by pounds) grew 29.8 percent, while milkfat (as measured by pounds) ballooned 37.19 percent.
Two products swoon
As cheese and butter continued to ascend, fluid milk and ice cream continued a slippery slide downward. In 2000, the two products accounted for 28.6 percent of all U.S. milkfat. That total descended to 19.2 percent in 2017 — a 9.4 percent overall reduction. Of course, that’s based on a percentage of the milkfat supply.
Another way to look at the data is on a skim solids percentage of the milk supply. Fluid milk and ice cream suffered the same fate.
- Fluid beverage milk fell from 33.8 to 23.1 percent of all skim milk solids from 2000 to 2017.
- Frozen dairy products (ice cream) dropped from 4.8 to 3.5 percent of all skim milk solids from 2000 to 2017.
When measured by that metric, whey products, which contain essentially no fat, climbed from 9.8 to 17.9 percent of the milk supply. Likewise, dry milk products grew from 7.5 to 11.3 percent, while yogurt grew from 1.4 to 3.6 percent. On a milkfat basis, neither fared as well.
More key findings
Jerry Cessna, an agricultural economist with the USDA’s Economic Research Service, took a deeper dive in to the data that he and his teammates assembled. Here is some additional insight:
- The milkfat in cheese accounted for about 42.5 percent of the total supply of milkfat, a gain from 37.7 percent in 2000.
- The product group accounting for the greatest percent of total skim solids is fluid beverage milk, at 23.1 percent in 2017. However, this is a decline from 33.8 percent in 2000.
- Although fluid beverage milk sales have declined, the milkfat content of fluid milk has climbed each year since 2013, as whole milk sales have grown while sales of most other types of fluid beverage have dropped.
To download the entire dataset, click on Dairy Data.