Starting in 2020, a price divergence between Class III and actual producer pay prices shook up risk management plans just as volatility re-entered dairy markets in a meaningful way for the first time in several years. Since then, when thinking about outlooks, producers must not only consider whether Class III and IV prices will move up or down but also whether their milk check will move in the same direction.

But when the Class III milk price moves less consistently with producer pay prices, futures contracts and other risk management tools that are based on the Class III price become less effective. That impact includes other risk management tools like Dairy Revenue Protection (Dairy-RP).
The reliability of the Class III milk price for risk management plans has improved recently. And I believe it will continue to be the most reliable reference price to plan against despite having decoupled from other prices in recent years.
Things changed in 2020
To see how Class III has moved with actual pay prices, we can compare it against either mailbox prices or All-Milk prices. Both metrics do a good job of tracking farm milk prices in my observation.
Mailbox prices published by the federal orders attempt to capture a net price, after premiums and deductions, in areas where 75% or more of the milk is pooled by a federal order. They are reported, however, with a considerable lag and some geographic gaps.
The All-Milk prices include premiums but not deductions, and they are reported for the top 24 milk-producing states at average milkfat levels for each state. For geographic simplicity, I’ll use state- and national-level All-Milk prices, adjusted to 3.5% butterfat.
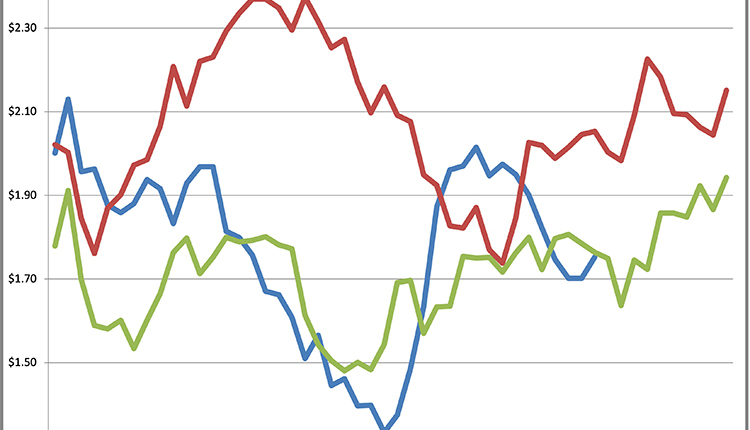
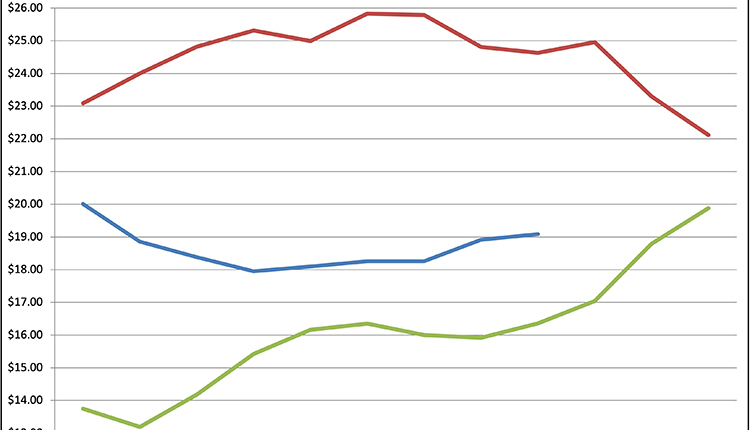
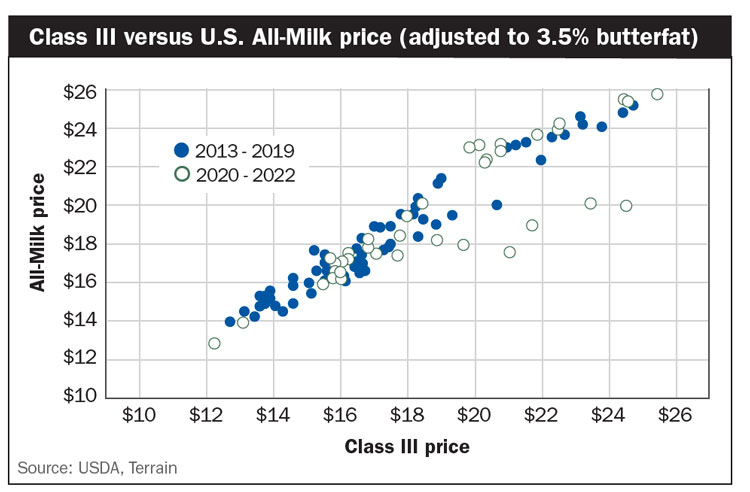
During the period from 2013 to 2019, the U.S. All-Milk price and the Class III price had a correlation of 98% as shown on the graph on page 157. That close relationship explains why Class III had been such a convenient benchmark and widely used hedging instrument. Since the beginning of 2020, however, that correlation has fallen to 87%.
The divergence from Class III hit some areas harder than others. In cheese-heavy Wisconsin, the correlation went from a near-perfect 99% to 90%. But as we stray farther from cheese country, for example, to California, that correlation fell from 96% to 86%. Florida went from 93% to 64%, as the state leads the nation in Class I fluid production.
Will it get any better?
I expect the worst of this divergence to be behind us, but some regional disparities will linger. In the post-2019 data, some of the most significant outliers were in 2020, when Class III milk prices moved erratically and the spread between Class III and IV prices widened severely. I don’t expect that magnitude of volatility between prices to reappear in the foreseeable future.
Most of the regional differences now stem from different product manufacturing profiles among the regions. As the scale of manufacturing continues to climb and regional specializations develop, the regional disparities in prices will remain.
Another contributing factor is the varying levels of ease with which milk can be depooled and repooled among the federal order regions. When a lower share of milk is pooled in the federal order, it weakens the ties between published federal order prices and pay prices.
If the Class III price climbs above the overall value of the pool, participants may find it advantageous (depending on the rules specific to each order) to depool what would have been Class III milk. Producers aren’t necessarily made worse off by this, depending on how the plant or cooperative handles those savings from depooling, but depooling does contribute to the divergence between Class III and pay prices and can depress Producer Price Differentials (PPDs).
PPDs deserve a separate discussion, but in simple terms, they can be thought of as the basis between the Class III price and the average uniform or “pool” price.
The regions that are affected the most by product specialization and depooling, such as the Southeast and California, will continue to experience more variation in how closely Class III prices correlate with Class IV. However, I believe the correlation will return to close to what feels familiar for producers in those regions.
Class III finds a new normal
For the remainder of 2023, I expect price levels to improve from what we have seen in the first quarter of 2023. I wouldn’t be surprised to see Class III climb to or above $20 per hundredweight (cwt.) later in the year if milk production remains constrained, exports remain robust, and lower food prices boost domestic demand.
If the Class III and IV prices remain within $1 to $2 of each other as they move, which I expect they will, we should be able to rely on the effectiveness of the Class III price as a hedging tool and benchmark for milk prices more broadly. It’s the unforeseen major disruptions that can create the most volatility and break these price relationships when they’re needed most. However, I believe that is a government policy discussion and not an individual farm risk management problem to solve.
Although some regions will still have some variables to account for — such as how much depooling could affect Class III and Class IV price relationships — I believe Class III will continue to be the most reliable base for risk management plans.