Butterfat levels bound skyward in past decade |
| Feb. 17 2022 |
| By Corey Geiger |
|
|
Updated February 17 at 11:40 am. While the 21-year average indicates a 3.735% butterfat level and a 3.106% protein average in the Central Federal Milk Marketing Order, that’s just part of the story. Annual butterfat tests remained relatively flat from 2000 to 2002 before beginning a downward trend that persisted through 2010, shared the Central Order’s Robert Schoening. Then everything began to change as demand for milk components started to grow, as shown in the graph. After bottoming out at 3.603% in 2010, butterfat moved past the 3.7% threshold in 2013, upward to 3.8% in 2017, and posted a record 3.984% in 2021. 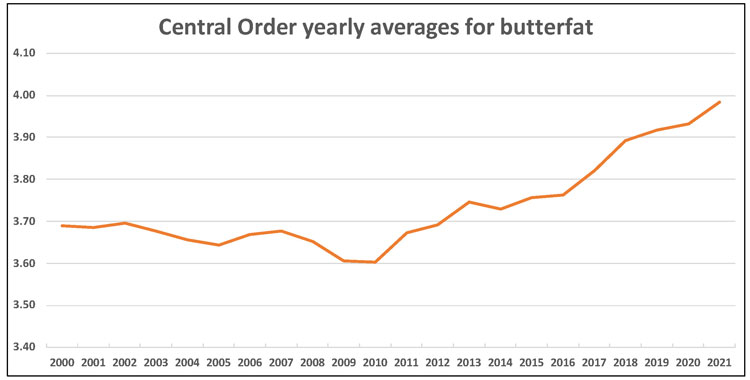 Given the movement from 3.933% to 3.984% in just the past year, it’s not a big leap to envision that shipped milk could average 4% butterfat this year. If realized, that milk would encompass the vast Central Order including the entire state of both Kansas and Oklahoma, major portions of Colorado, Illinois, Iowa, Nebraska, South Dakota, and Missouri, along with the southwest corner of both Minnesota and Wisconsin. Another order, same story The butterfat story is much the same in the Upper Midwest Federal Order. The only change in the narrative is that butterfat percentages vaulted even higher, climbing from 3.68% to 4.04% from 2010 to 2021.
During that same 12-year horizon, protein percentages climbed from 3% to 3.17% in the order that includes milk shipped from the majority of farms in Minnesota and Wisconsin, along with portions of North and South Dakota, northern Illinois, northern Iowa, and Michigan’s Upper Peninsula. 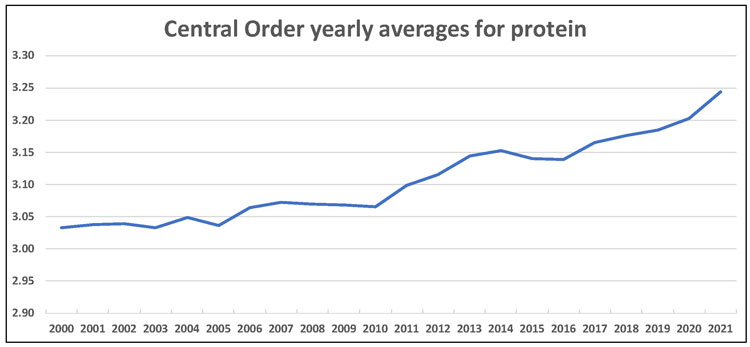 While the Upper Midwest outperformed the Center Order on butterfat, the story flipped on protein. In 2021, the nine-state Central Order averaged 3.244% protein, up from 3.203% the prior year. Historically speaking, protein percentages hovered from 3.033% to 3.099% from 2000 to 2011 before making their ascent in the Central Order. From 2012 to 2016, averages shifted within a 3.116% to 3.153% range. That followed with a significant movement:
While some industry experts have pointed to changing breed composition, this shift in butterfat and protein percentages has more to do with genetics and genomics, feeding strategies, and cooperative-imposed supply controls that, at times, limit pounds of milk shipped but place no limits on components that have been in great demand. As for breed composition, in 2020, 84% of the semen sold in the United States was Holstein. Meanwhile, the Jersey breed accounted for 14% of semen sales. That is according to a dataset from the National Association of Animal Breeders, the trade association for the major artificial insemination (A.I.) studs. |