
Market Psychology
The prices of all dairy products have been mixed in the last month. The CME block cheese price fell by 9% in April, after a short mid-month rally. It is now $2.07/lb. This lower cheese price of course is reflected in a weaker Class III price, which is well below the April Class III price (see below). Exports seem to have peaked, although they continue to be high compared to pre-2013 levels. CME butter prices are up 12.5¢/lb. in the past month at $2.10/lb. The butter price fell through much of April before a strong rally in the past week to climb 20¢/lb. The CME skim-milk powder price fell by 13¢/lb. to $1.965/lb. Dry whey prices rose 3.8% to $0.654/lb.
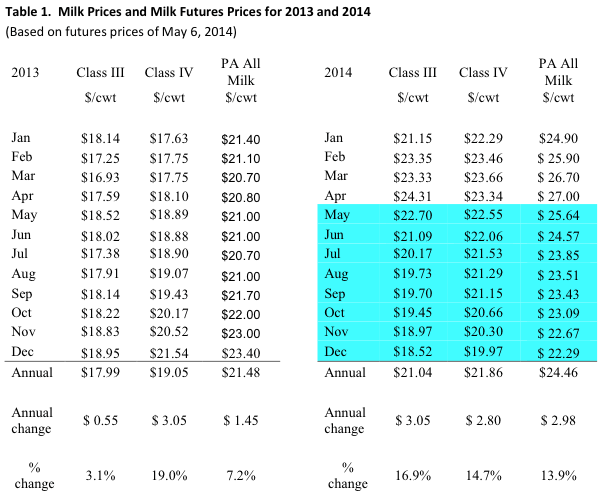
Table 1 lists some past and estimated future milk prices. The April Pennsylvania all-milk price was $0.30 higher than March at $27.00/cwt., another record high price. Feed prices are rising, but so far the milk price has risen also. The April Class III price was $0.98 higher than March at $24.31/cwt. The Class III futures price for May is $22.70. Average Class III futures prices for the remaining eight months of 2014 are up $1.79 over 2013 prices for the same months at $20.04. As seen in Table 1, the May price is expected to be the highest for the rest of the year, since current expectations are that cheese markets will fall as the year progresses. The March Class IV price was down $0.32/cwt. from March at $23.34/cwt. The prices for Class IV futures average $21.19/cwt. for the rest of 2014, also up from last month. Like Class III, Class IV futures prices are expected to decline as 2014 progresses. Recent PA all-milk prices and the forecast prices for the rest of 2014 based on the futures prices are also shown in Table 1. The forecast all-milk prices for 2014 average $2.46/cwt. above the average for 2013, with the higher prices in the first half of the year.
The U.S. dollar is slightly lower in the past month against the Australian and New Zealand dollars and the Euro. This change was not tied to any particular news that I can see. Chinese dairy imports seem to be waning, although they are still enormous in a historical context. The New York Times reported yesterday that "The Chinese government has imposed new limits on foreign brands of milk powder and infant formula sold in China." Presumably China is trying to reduce dairy imports, which would certainly hurt milk prices.
Corn and Soybean Markets
Corn has risen since last month, ending at $5.13/bu. (up 3.4%) for the May 2014 contract. The problems in Ukraine have hurt the value of its currency, increasing the costs of farm inputs and creating the expectation of a smaller crop. Additionally the spread of the turmoil in Ukraine to Odessa creates a potential export problem by water, since Odessa is the major port of Ukraine. Soybeans are almost unchanged from last month, with a variety of bearish news that the market is ignoring. Soybeans and soybean meal are up a bit since last month, with beans up $0.02/bu. to $14.64/bu. for the May 2014 contract and meal up $10/ton at $487.
Income over Feed Costs (IOFC)
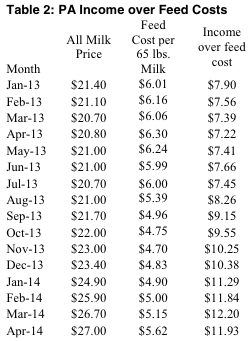
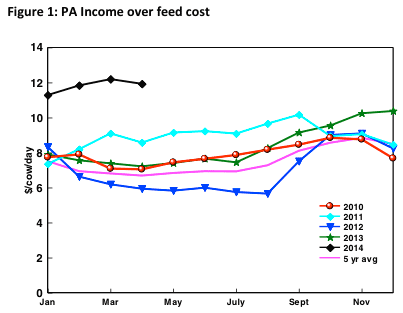
Penn State's measure of income over feed costs fell by 2.2% in April, but it is still very high. Figure 1 shows how unusual these values are compared to recent years. This decrease is 27¢/cow/day. The April value of $11.93/cow/day is the second highest value since we began calculating this measure. Although the milk price rose in April, so did the feed cost, with the net effect being a small decrease in IOFC. Feed prices rose by 9.1%, with higher prices for all three ingredients in the ration. The cost of feeding a cow rose by 47¢/day to $5.62. Income over feed cost reflects daily gross milk income less feed costs for an average cow producing 65 pounds of milk per day. Figure 1 and Table 2 showing the monthly data follow.
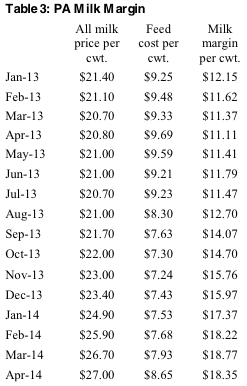
The allocation of the revenue per hundred pounds of milk is shown in Table 3. The milk margin is the estimated amount from the Pennsylvania all milk price that remains after feed costs are paid. Like income over feed cost, this measure shows that the April PA milk margin was 2.2% lower than in March.
Milk Production
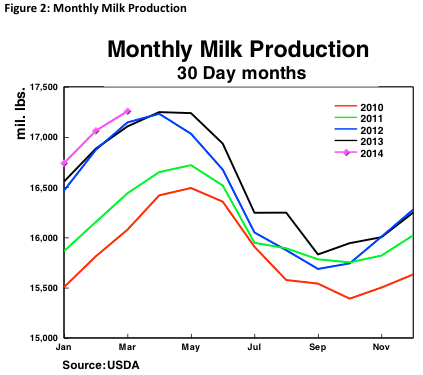
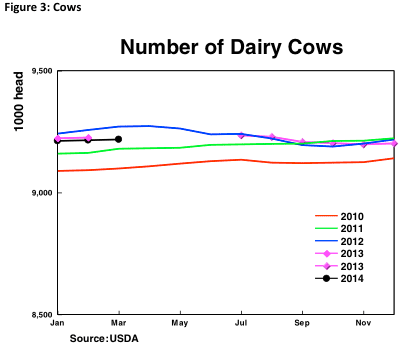
As can be seen in Figure 2, milk production for March was slightly more than for March 2013. This lack of growth (0.9%) follows two months of similar change. Given the profitability in recent months, this small increase is notable. The number of dairy cows is shown in Figure 3. No cow numbers were collected in March 2013, so no year to year comparison is available. Compared to last month, cow numbers are very stable.
By Jim Dunn
Professor of Agricultural Economics
Penn State University
5.7.2014