The results of early detection and prompt treatment (prior to clinical signs) of ketosis can quickly add up – a savings your budget will appreciate.
For example: Ketosis alone can cost a 1,000-cow dairy with a 30% ketosis rate about $87,000 a year. But by lowering the ketosis rate by just 5%, the 1,000-cow dairy could save $14,500 per year.[1] Apply this example to your farm. How much money could you save?
Here’s how we recommend using your activity monitoring system’s data to help lower the ketosis rate on your farm:
1. Monitor individual transition cow activity.
Chewing activity (eating + rumination) can be a good indicator for ketosis. Look at a cow’s chewing activity 10 days before she calves compared to 10 days after she calves. You should see natural peaks and valleys. Chewing time crashes are normal at calving, but cows should begin to rebound within a day or two.
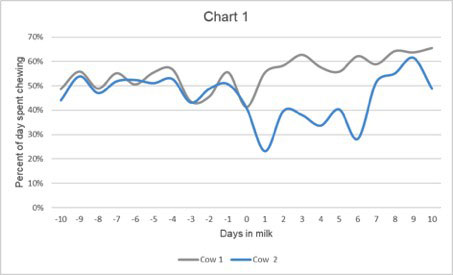
In a real-life example, Chart 1 shows the chewing time difference between a healthy cow (Cow 1) and a cow with ketosis (Cow 2). Cow 1 bounces back quickly to normal chewing time after calving. Cow 2’s chewing time drops significantly the day before calving and stays depressed until day 6, when she receives treatment for ketosis.
Why didn’t this cow get treatment until day 6? She wasn’t showing clinical signs of ketosis. And even though an alert was sent about Cow 2’s reduced chewing time, she wasn’t treated. In an ideal situation, Cow 2 would have been evaluated and treated as soon as the alert was sent (day 1), and she would have bounced back faster.
Use the data to look at how a cow’s chewing time compares to the rest of her group. If the whole group is experiencing activity or rumination issues, check the pen and the pen’s ration. There could be a management issue at hand that needs to be dealt with, like nutrition or environment. If the rest of the group appears healthy compared to individual cow data, you might be dealing with a ketotic cow.
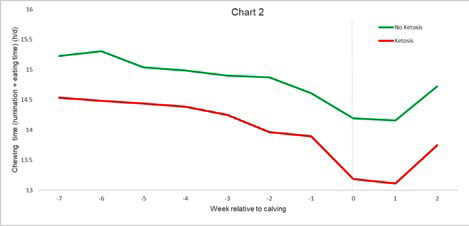
Chart 2 is an example of what an activity monitoring dashboard could look like. The green line represents the average chewing time for a group of healthy cows. The red line represents a group of cows consistently chewing about an hour less than their pen mates, starting seven weeks before she calves. This is not normal and can indicate ketosis.
If there’s one thing I’d suggest so you can continue getting more from your activity monitoring system – it would be to trust the alerts you receive and act on them. Alerts exist for a reason and are there to help you catch things that go unnoticed by the human eye.
To learn more about activity monitoring systems and how they can help your farm reach your productivity goals, contact Arnold at arnold.harbers@nedap.com, or visit nedap.com/cowcontrol.

[1] McArt, J. A. A., Nydam, D. V, & Overton, M. W. (2015 Hyperketonemia in early lactation dairy cattle: a deterministic estimate of component and total cost per case. Journal of Dairy Science, 98(3), 2043–54.