Nutritional analysis of feedstuffs, particularly forages, is the foundation of feeding programs on a dairy. There are many articles in the popular press that indicate widespread perceived differences between feed laboratories but very few based on research. We were interested in determining how much variation there was within and between feed laboratories and forage types.
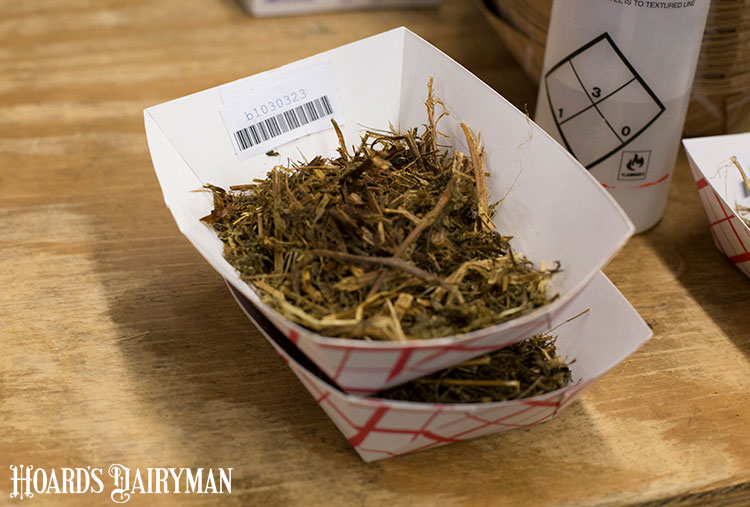
Twelve laboratories were selected for a blind test to analyze three hay types: mixed grass, prebloom alfalfa, and prebud alfalfa. Samples from a single source of each forage type were sent in duplicate, three times, a month apart. The samples were analyzed for DM (dry matter), CP (crude protein), NDF (neutral detergent fiber), and ADF (acid detergent fiber). Significant inter- and intralaboratory differences were found for CP, ADF, and NDF.
Three key findings
There were three findings that stood out to us.
- The first was the DM percent. Before laboratory submissions, DM percent was determined for all samples by drying for 72 hours at 131°F. Out of 216 submissions, 49 percent produced negative differences when subtracted from our DM, indicating that samples increased in moisture content after mailing. For labs in areas with humidity higher than our area, samples took on moisture and the results could affect ration balancing.
- The second was the variability in determining NDF percent — especially for the prebud alfalfa. NDF percent is the basis for many calculations in ration balancing programs. The standard deviations, across all labs, for the three hay types ranged from 3.5 to 4.3, meaning that two out of three samples will fall between plus or minus 4 percent of the average (standard deviation is a measure of variability between samples; higher values equals more variation). The range (lowest to highest) in values for each of the three hay types spanned approximately 20 percent.
- The third was the RFV (relative feed value) and is related to the NDF percent. The standard deviation, across all labs, for the mixed grass and prebloom alfalfa was about 13.8 points and had lab results that spanned 75 points. The pre-bud alfalfa had a standard deviation of 32 points and values that spanned 132 points. About 71 percent of labs had RFV values with ranges greater than 30 points for prebud; USDA hay quality groupings span 20 points. No wonder there are fights over analysis.
Our take
We did almost everything we could to send the same sample to all labs every time. So, do we think labs are doing a bad job? No, in general, they are trying hard to give the best analysis possible. We saw some labs that were fairly consistent. You might say that their business depends on it. However, sometimes errors creep in during the mad dash to have low turnaround times, or high volume days, or just analyzing a representative sample.
Our suggestion would be to send samples in duplicate and average the two values. We also think it’s time to consider doing away with RFV and develop a pricing system based on NDF percent or go to RFQ (relative forage quality) as the standard. In summary, there can be large variations between and within laboratories that may impact accuracy of forage analysis.
Click the link to read an earlier report utilizing Jerry Severe and Allen Young's data in “Feed testing most important to dairy.”
July 24, 2017