Today’s milking technology provides numerous data points for dairies to use in their day-to-day routines and management decisions. With software and tools to monitor and track every step your cow takes and every pound she produces, it can be difficult to know which data points to look at and what they mean specifically for milk quality.
Using the below measurables, paired with time-honored tools of good cow sense and somatic cell count (SCC), you can make timely and effective management decisions.
- Conductivity. The electrical conductivity of milk can detect subclinical mastitis. Cells in the udder release sodium and chloride ions as a response to inflammation, making conductivity an accurate indicator of inflammation in the udder. While “good” conductivity levels are relative to the individual cow, a measurement above 8 mS/cm (millisiemens/centimeter) indicates high relative conductivity. Your milk meter and herd management software can work together by generating an alarm when an individual cow reaches its relative conductivity threshold.
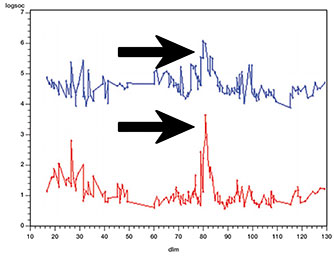 The graph illustrates how LDH correlates with SCC.
Lactate dehydrogenase. LDH levels are also an indication of subclinical mastitis. They exist in large amounts inside the cells of different mammary tissues, but milk levels are generally low. When udder tissue is damaged and cells are destroyed due to a mastitis infection, LDH is released into the milk. Tissue damage in other parts of the body also releases LDH into the blood stream, but this usually does not affect the LDH level in milk. DeLaval Herd Navigator makes it easy to measure LDH on-farm.
- Milk Flow Data. Group milk-flow data from your farm management software can indicate whether the cows are being prepped appropriately and if the milking system is operating correctly. The top 3x parlor herds in the US are averaging 11.6 lbs/min during peak flow, while the lower-performing herds average 7.6 lbs/min. Peak flow rates are one indication of udder prep; the higher the peak flow, typically, the better udder prep. A longer milking duration with a higher flow during the latter part of milking can be an indication of inadequate stimulation time or prep-lag time. If cows are not being prepped properly, the milkers are not only likely to miss signs of clinical mastitis but also failing to remove bacteria from teat skin and teat ends.
- Liner Slips and Unit Kickoffs. When a liner slips or a cow kicks off the milking unit, bacteria from the environment can enter the milking system increasing the risk of high bacteria counts and/or new mastitis infections. There are many factors that can influence the number of liner slips and unit kickoffs, including but not limited to: inappropriate teat end vacuum level for the liner chosen; inappropriately matched liners to teat size; extending liner usage beyond manufacturer’s recommendations; teats not dried completely prior to unit attachment; and poor unit alignment and take-off settings. A farm can benchmark its performance against outcomes and changes that are made in the parlor (such as a liner switch). Monitoring these parameters over time while looking for trends or anomalies will provide the most value.
Sources:
Dr. Brandon Treichler and Dr. David Reid. Review of parlor summaries from 3x herds in the United States. National Mastitis Council Annual General Meeting proceedings (2013), pp 85-94
