By Jim Dunn, Professor of Agricultural Economics, Penn State University
Market Psychology
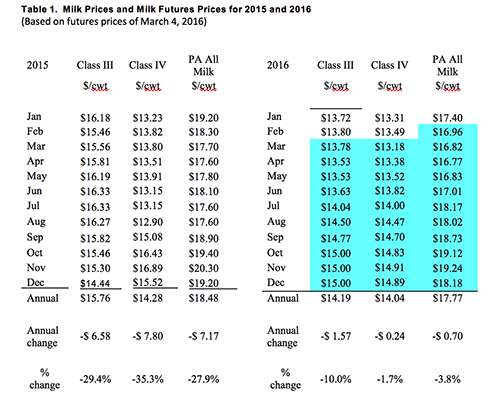
Both Class III and Class IV milk prices were up slightly from January, although my estimate of the February all-milk price is slightly lower than last month. The butter price was down 12.5 cents to $2.04. There was no precipitous drop, but rather just a gradual downward drift. The real issue is that world milk production is up, with EU milk production up 2.9% since quotas ended last Spring. While some countries, especially Britain and France, are struggling in the absence of quotas other countries are expanding. Furthermore, New Zealand and Australia are being impacted less by El Niño than was expected. Cheese markets are essentially unchanged from January at $1.517/lb., having recovered by 7¢/lb. in early March. Cheese futures are lower until July and then trend upward to over $1.69 for the remainder of 2016. The dry products have risen, with skim milk powder up 3% and dry whey up 4.4%. The February Class III price of $13.80 is 0.6% higher than January, while Class IV is up 1.3% at $13.49. Last year at this time butter was 30¢/lb. lower. The domestic demand for dairy products is slow and our exports are still affected by unfavorable currency values. Although the New Zealand's dollar is up 2.4% and the Australian dollar is 4.8% higher than a month ago, the Euro has dropped 4.3%. China's continuing economic woes are hurting the U.S. economy in general and our agricultural exports are weak across the board. Milk production in the major exporting countries continues to rise, while Chinese imports are recovering ever so slightly. According to the Dairy Export Council, the dollar gained 11 to 15% against the three major dairy exporters in 2015. This organization does not expect dairy exports to recover in 2016. I estimate the February Pennsylvania all-milk price to be $16.96/cwt, down $0.44 from January and the March price to be $16.82. The dairy futures market prices (See Table 1) show continuing low prices for Class III for the next few months, although rising in the latter half of the year. They average $14.19/cwt. for 2016 overall, with prices before August below this average. The Class IV futures prices show a similar pattern, although with a lower price for the year overall. The February Class IV price was up $0.18/cwt. from January at $13.49/cwt., reflecting weak butter market. My forecast for the average Pennsylvania all-milk price for 2016 is $17.77/cwt., or $0.70 below the average of 2015. Overall the price outlook for 2016 is weak.

Corn and Soybean Markets
Corn markets have dropped a little in the past month, and soybeans and soybean meal have stayed the same. The world economy and its challenges continue to hang over all major agricultural markets. The large world feed inventories do not suggest higher prices, and both Brazil and Argentina are expected to produce record crops, so beans and corn should remain low for the foreseeable future.
Income over Feed Costs (IOFC)
Penn State's measure of income over feed costs fell by 2.4% in February from January, as lower feed prices combined with slightly higher milk. Figure 1 shows how these values compare to recent years. Note that February's income over feed cost is lower than last year's value. February's value for IOFC of $6.62/cow/day is not good. Income over feed cost reflects daily gross milk income less feed costs for an average cow producing 65 pounds of milk per day.
Table 2 and Figure 1 showing the monthly data follow.
The allocation of the revenue per hundred pounds of milk (milk margin) is shown in Table 3. The milk margin is the estimated amount of the Pennsylvania all milk price that remains after the feed costs per hundredweight of milk production are paid. Like income over feed cost, this measure shows that the February PA milk margin was 2.4% lower than in January.
Given that corn and soybean meal prices are not expected to rise very much, the moderate increases in milk prices shown in the futures markets for the second half of 2016 would increase IOFC should they occur.
Milk Production
The latest milk production report showed January milk production up 0.25% from a year earlier (Figure 2). This increase in milk production is very small and lower than the small increases of the second half of 2015. The Midwest continues to have very sizeable increases in milk production, while California and several states in the West continue to decrease production with their drought. Other than New York, which increased milk production by 4.3%, the Northeast is essentially unchanged. Pennsylvania increased milk production by 0.3% over a year earlier.
The monthly cow numbers are shown in Figure 3. The January cow numbers were 0.02% more than in January 2015. An estimated 30,000 cows were killed in the end of the year severe snowstorm in west Texas and New Mexico.

3.8.2016


