One of the key factors affecting profit on dairy farms is udder health. Cows with a noninfected mammary gland produce more milk and stay in the herd longer than those harboring an infection. The milk from these cows also is more wholesome for the consumer. Herds that meet certain criteria of udder health often receive a premium for their milk.
For many years, the level of somatic cells in milk has been used to reflect the infection status of the gland. When infectious agents enter the udder, the cow’s immune response sends somatic cells to respond. And while the cells usually succeed in thwarting the infection, some damage to the milk secreting tissue occurs, resulting in less production and lower milk quality.
In general, a somatic cell count (SCC) of over 200,000 cells per milliliter of milk indicates infection in the cow. For many years, I have suggested a goal for bulk tank SCC of 200,000 or below. Many herds today do far better than that. An average at this level represents many cows below this number with a few well above it.
Two more important measures
There are two other numbers that are important. One of them is the linear score for the herd and the other is percent of the herd not infected.
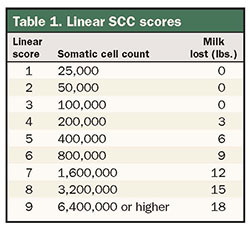
The important thing to learn from Table 1 is that a cow that moves from 100,000 to 200,000 loses the same amount of milk as one that rises from 400,000 to 800,000, or from 800,000 to 1,600,000. Now let’s consider two groups of five cows, which average 400,000 as their somatic cell count. It makes a big difference how that average is derived, as illustrated in Table 2. 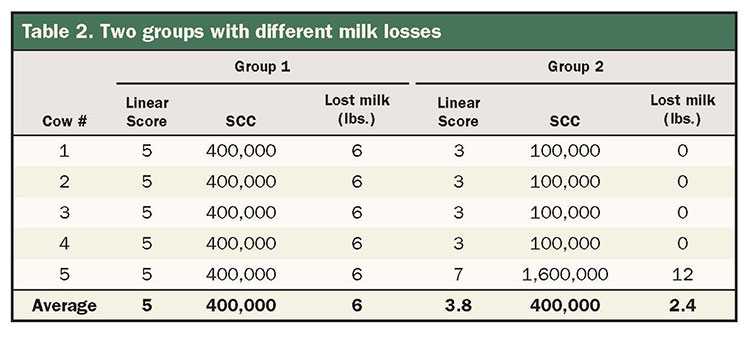
A tale of two groups
With the first group, all of the cows have a moderate infection, and all are losing about 6 pounds of milk, or a total of 30 pounds. In the second group, four of the cows are not infected and lose nothing, while the fifth is severely infected and loses 12 pounds, so the total is 12 pounds lost, or 2.4 pounds as the average. Notice that while the average SCC is the same at 400,000, the linear score for the second group is 3.8 compared to 5 for the first group.
Linear scores are a much more accurate indication of milk loss than is the SCC. Notice also that in the second group, four of the five cows are considered noninfected, while in the first group all of the cows are infected.
With this understanding, you need to consider more than just somatic cell count when evaluating the udder health of your herd. Although my example uses a value of 400,000 SCC, the same principle applies with lower numbers. A herd with SCC of 200,000, linear score 2.9, and 70 percent noninfected has significantly worse udder health than one with 200,000, 2.2, and 80 percent.
The very best herds do far better than this. I recently saw the DHIA report from a herd with a SCC of 58,000, linear score of 1.6, and 91 percent of the herd not infected. This correlated to production of 97 pounds, with 6.5 pounds of components. Now those are some worthy goals for every herd.
There is yet another important component of udder health, which is clinical cases. Some herds attain very low cell counts and linear scores but struggle with cows having clinical mastitis. I will address that subject in my next column.