The information below has been supplied by dairy marketers and other industry organizations. It has not been edited, verified or endorsed by Hoard’s Dairyman.
Milk fat is a key factor in determining how farms get paid for the milk they ship. Small changes in fat percentages, whether an increase or decrease, can have a big impact on a milk check; even if there is no change in actual production volume. While fat percentage measurements have been around for over a century, and are widely used in combination with protein percentages to analyze herd performance, new and innovative work is emerging to analyze actual fat composition – what makes up that fat percentage you see?
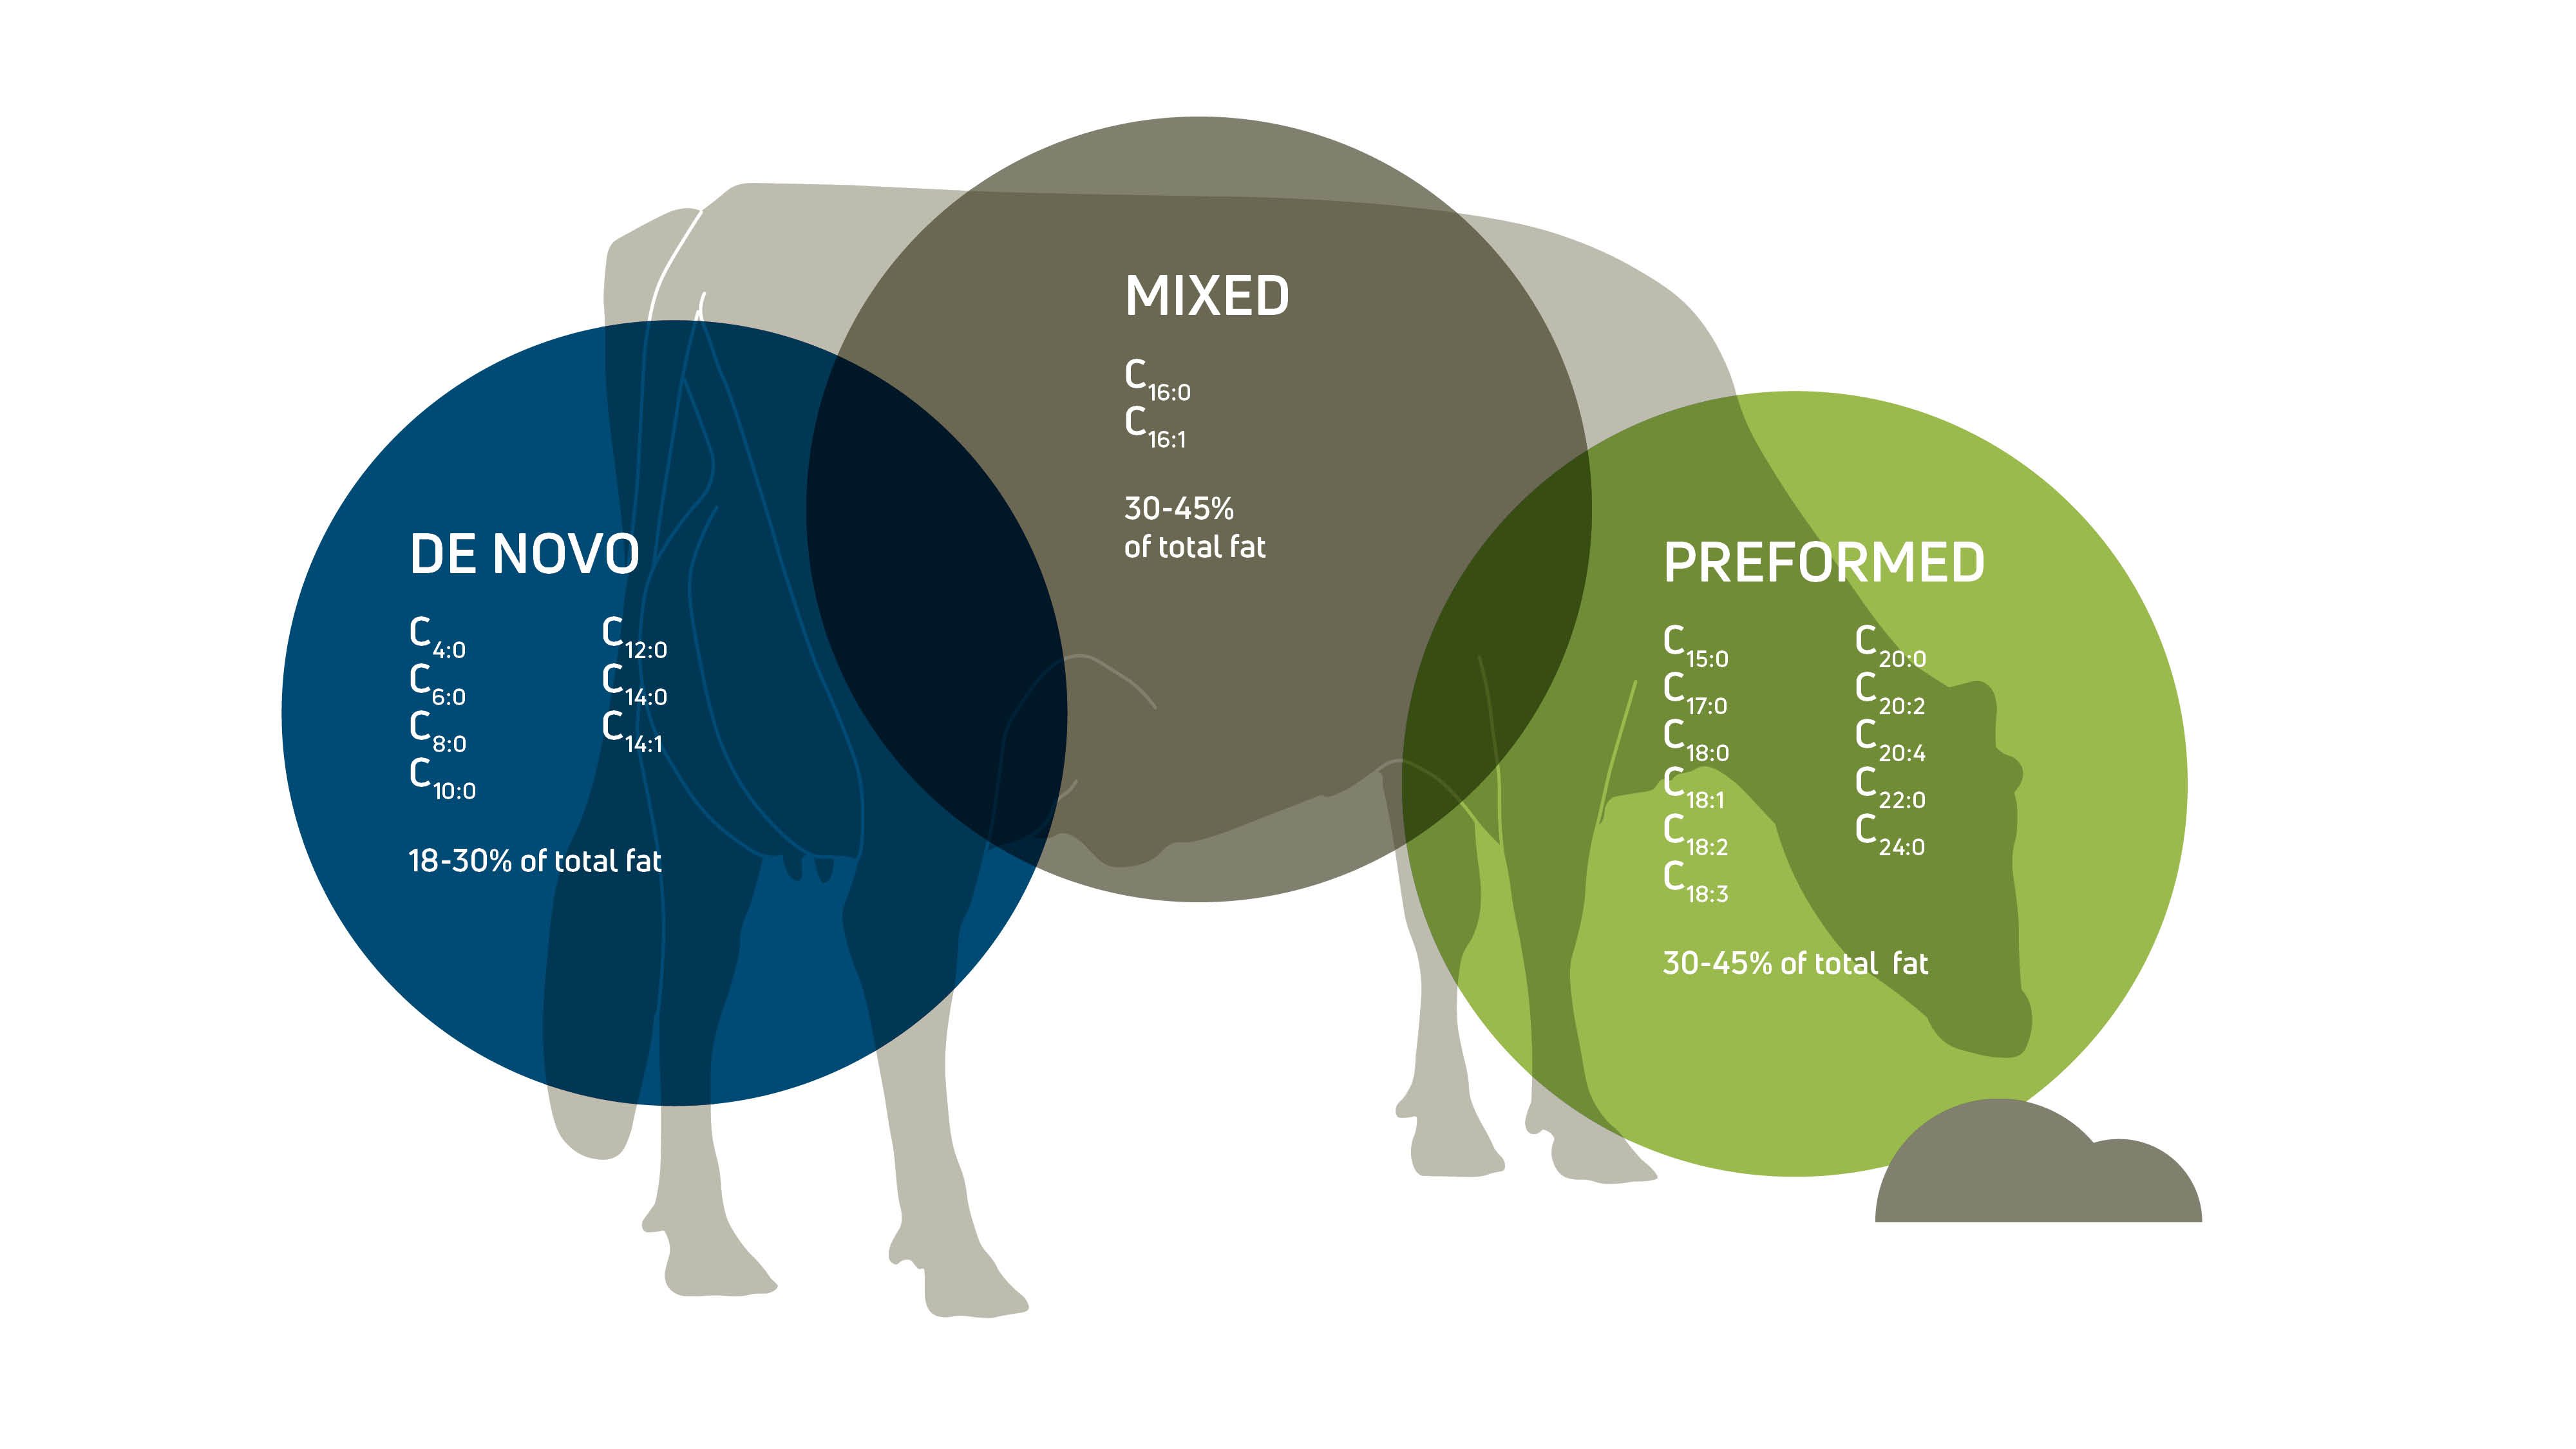
Research by Cornell University has shown that the fat in milk is comprised of different milk fatty acids. Carbon chain length and number of carbons (for example C4, C6, C18:0, saturated and unsaturated) differentiate fatty acid types. Instead of looking individually at each fatty acid, they’re grouped based on their origin; de novo, mixed and preformed fatty acids (Figure 1).
The significance of fatty acids can be found in how each of the profiles are impacted by rumen health, feeding and various aspects of herd management – providing earlier and more detailed insights on changes taking place in the cow and herd that ultimately could result in a higher or lower overall fat percent in milk.
Origins are a source of insight
Each fatty acid group serves a unique purpose in informing us about cow performance based on their origin.
De novo fatty acids originate from the production of butyrate and acetate in the rumen, which is then transported to the udder for synthesis into the de novo fatty acids found in milk. With consideration to their origin, these fatty acids are a strong indicator of rumen function, and are the most significant driver of bulk tank butterfat.
Preformed fatty acids are derived from the diet or adipose tissue from the cow. In early lactation, preformed fatty acid levels are typically high in the milk as cows mobilize their body fat to meet energy needs for milk production. Dietary C18’s may also be deposited into the milk as preformed fatty acids.
Mixed fatty acids are 16 carbons in length and may originate from the diet or synthesis within the cow. Feeding palm fats in the diet will strongly influence the levels of mixed fatty acids found in the milk.
A new individual cow measure
While measuring fatty acids is interesting and insightful, it hasn’t always been easy. Once a time-consuming, expensive laboratory process, advances in FTIR (Fourier Transform Infrared Spectroscopy) milk analysis has opened the door to gathering de novo, mixed and preformed fatty acid measurements in a relatively easy way. Payment or bulk tank milk samples can be cost-effectively analyzed and provide a single daily value that can be used to monitor overall herd changes.
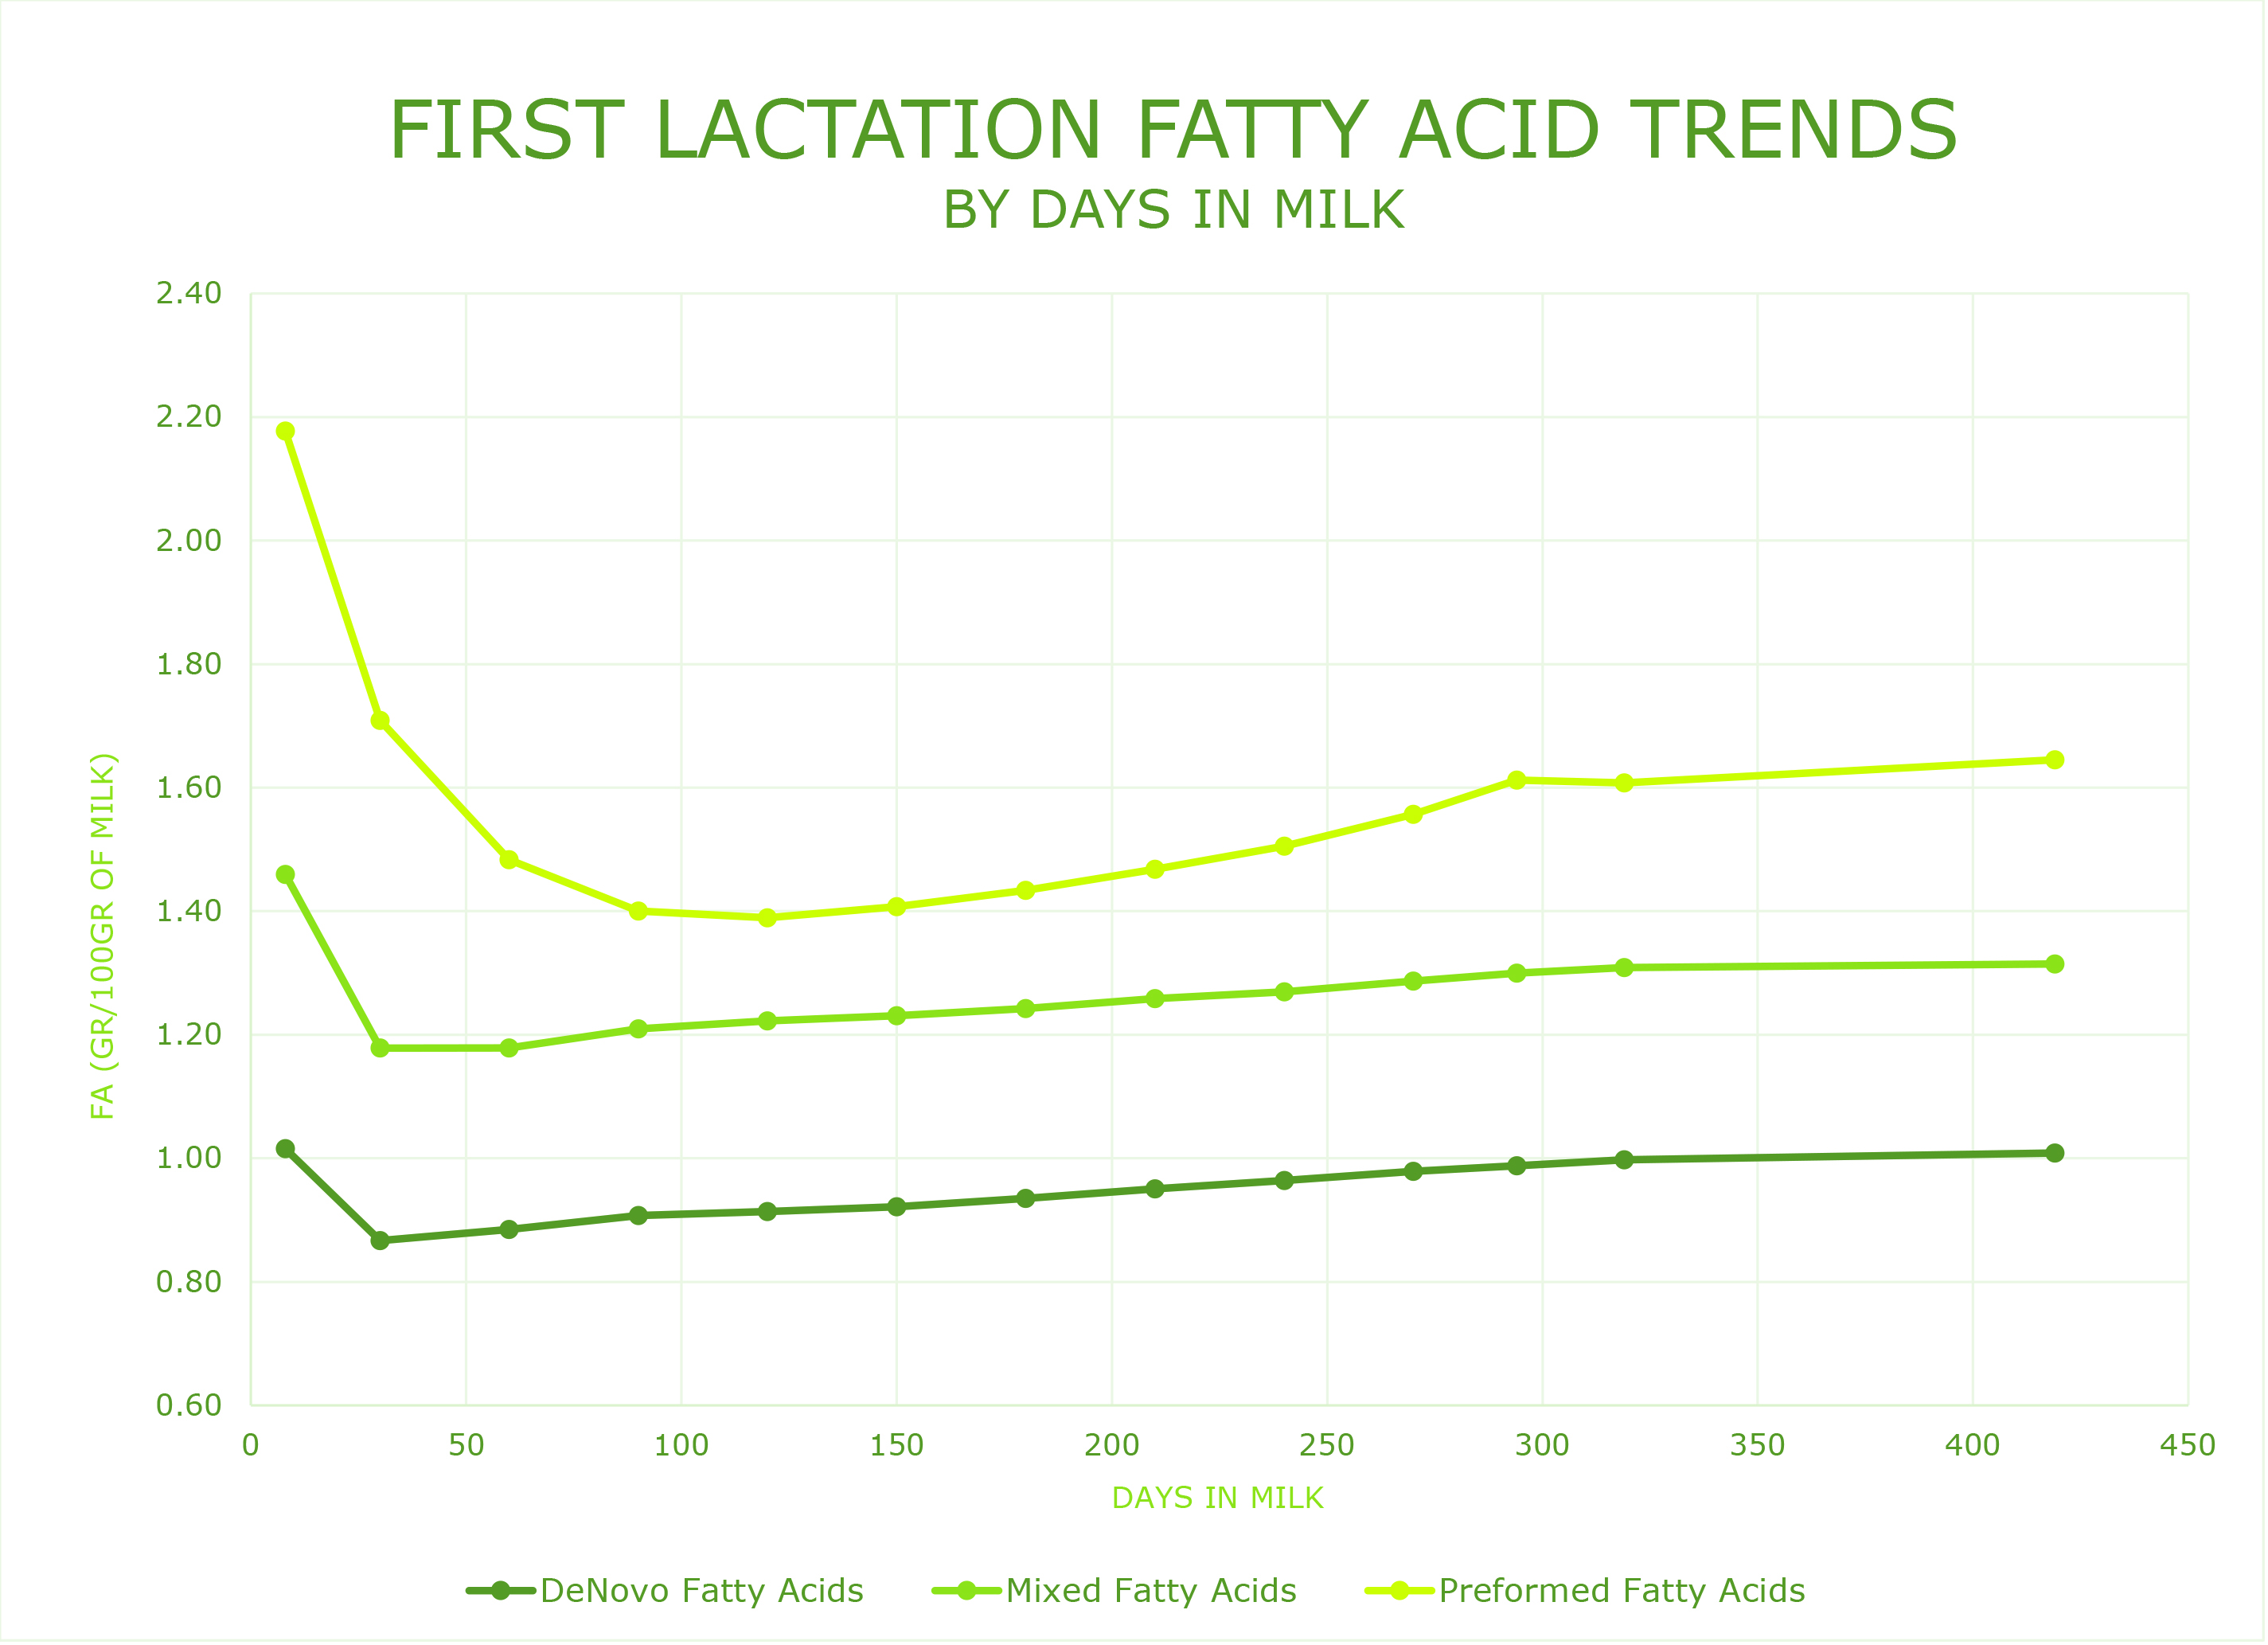
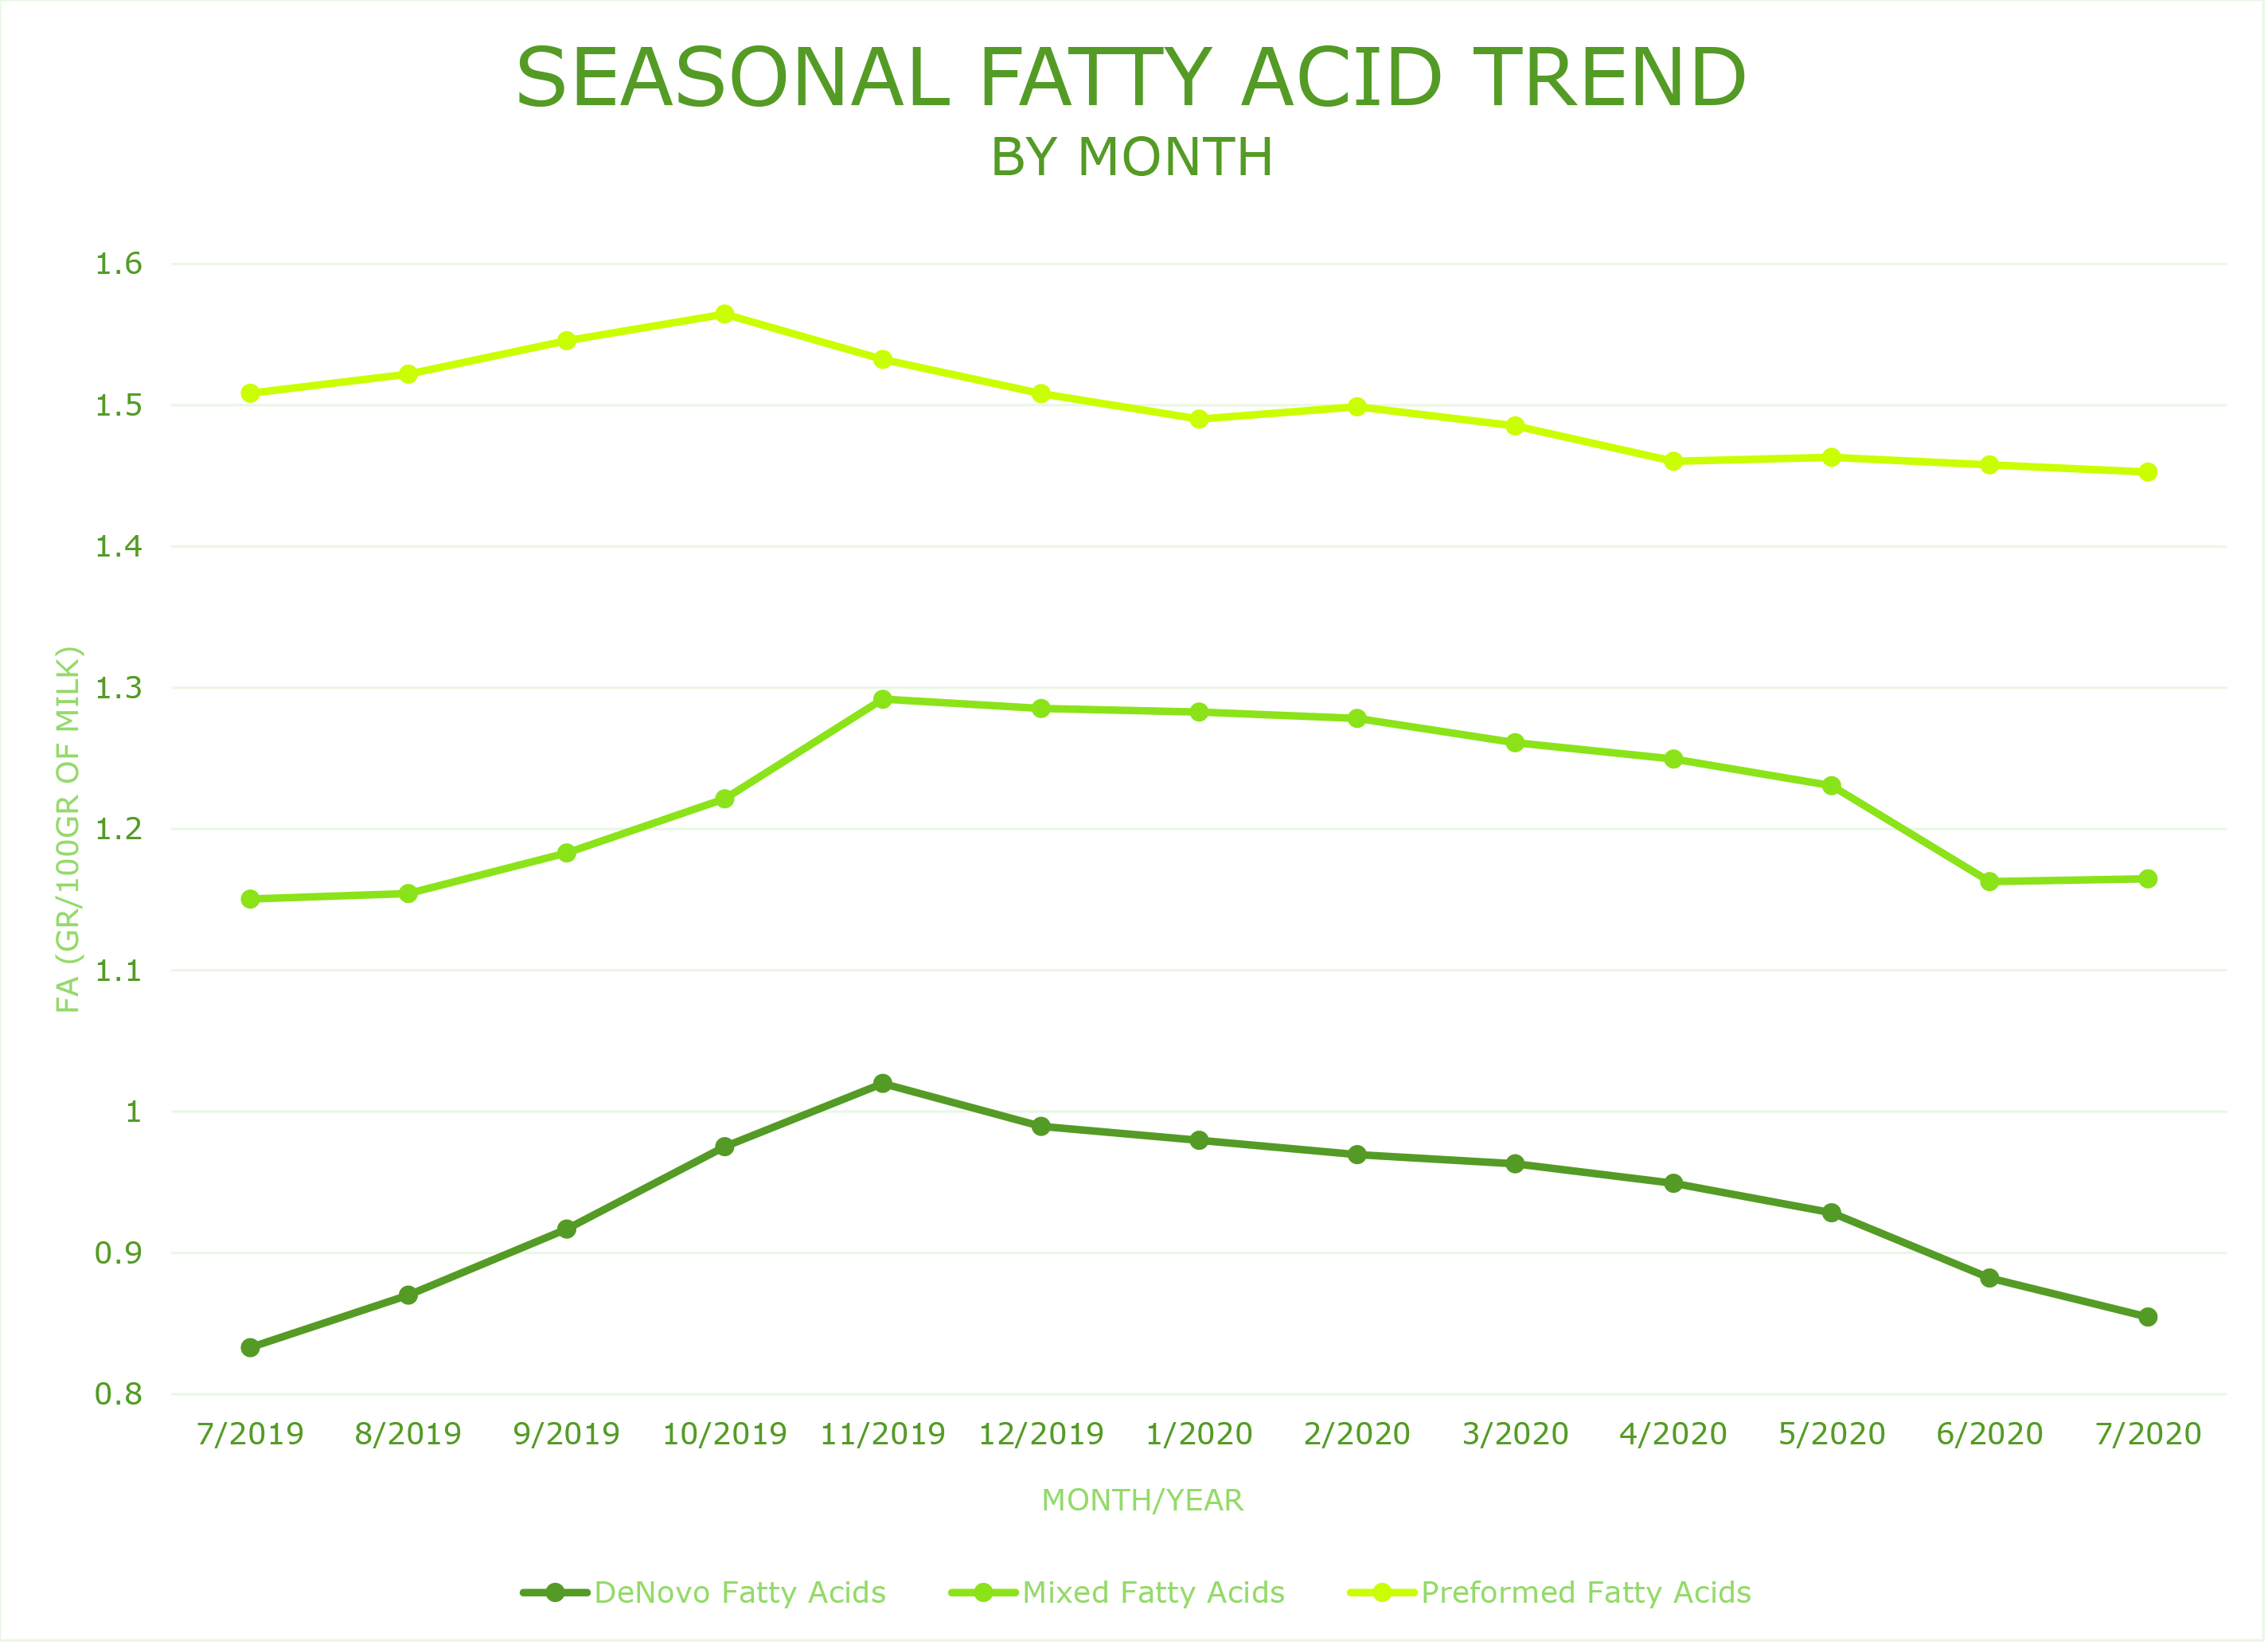
Although an overall herd measurement offers valuable information, the fat composition can be influenced by parity, stage of lactation, and season, as shown in figures 2 and 3. Understanding the impact these factors may have on your overall bulk tank measurements makes it more challenging to look at the changes in fat composition without also considering other changes in the herd.
Therefore, especially on large herds that group cows in pens and have different rations, it is important to look more closely at changes at the pen or group level and also take into account the stage of lactation and seasonality. VAS is proud to launch the first tool that measures individual cow fatty acid composition in the US.
VAS’ RumINSIGHT provides dairy farmers with a tool to track changes in milk components by combining individual cow data to analyze pen/group and overall herd performance by comparing current month performance against the previous month, with the ability to benchmark against other Holstein and Jersey 2x and 3x milking herds.
Trusted Measurements
VAS (formerly AgSource Dairy) collaborated for four years with FOSS instruments, University of Wisconsin Dairy Science, Lactanet Canada, and other European milk recording organizations and universities to develop the models for the various milk fatty acid measurements, utilizing FOSS FTIR milk analysis equipment. Data from North America, Europe, and Asia were combined to provide accurate measures of individual milk fatty acids. Ongoing collaboration with Lactanet and Laval University on calibration standards ensures an accurate fatty acid reading every time.
The result? A full year of fatty acid data has been collected on approximately 1,700 herds with over 5 million test day records. This data collection has been instrumental in building a report and benchmarks to provide producers and their management teams with a trusted product.
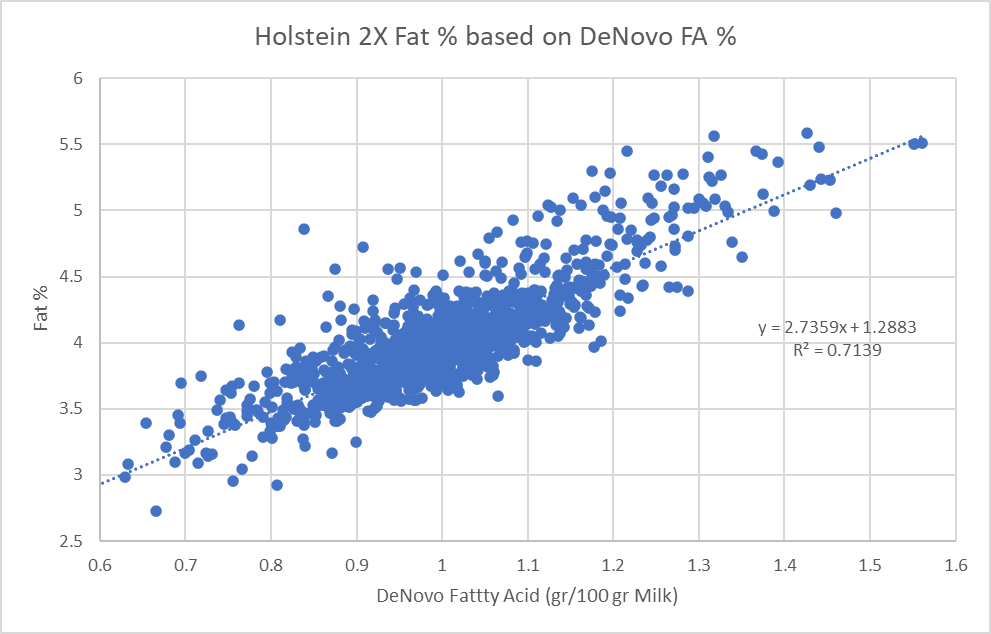
Cornell University has been at the forefront of fatty acid research, led by Dr. Barbano et. al1. Despite differences in laboratory equipment between Cornell and VAS, similar relationships of all fatty acid levels have been identified. VAS also emulated historically researched bulk tank fatty acid values by using individual weighted cow measures to create a composite value reflective of the bulk tank. Figure 4 shows an example of the correlation between de novo fatty acids and the overall fat percent for approximately 1,130 Holstein 2X herds during the month of January 2020.
Making ‘cents’ of Fatty Acids
Unless there is value in utilizing fatty acid composition data to improve the bottom line, the applications will be limited.
Our dataset has shown direct correlations between fatty acid composition and bulk tank components, drawing a strong argument for implementation of monitoring and measuring on-farm. Herds whose de novo composition was 0.1g/100g milk higher than their counterparts averaged 0.27% higher overall fat in the bulk tank. Similar results were seen in Holstein 3x herds, with 0.25% higher fat and 0.07% higher protein. Jerseys showed a 0.24% higher fat and 0.1% higher protein.
To put those numbers into perspective, let’s take a look at a 1,000 cow dairy producing an average 80 lbs of milk per cow, with an overall fat and protein of 3.5% and 3.1%, respectively. With a price of $1.3218 per pound of fat, if the herd increases its de novo fatty acid by 0.1g/100g milk, using the relationship from Figure 4, an additional $264 in daily revenue would be realized. If the cost associated with this change were $200/day, the net result would be a $64 increase to the bottom line, or $23,360 annually – a nice return on investment.
Summing it up
While milk fatty acid analysis may be a relatively new concept to most, there is value to be realized in monitoring and measuring this data with new innovations in reporting. Driving more revenue to your bottom line has never been more critical.
Sources
1The Use of Milk Fatty Acids as an Indication of Energy balance in dairy cows, Barbano D.M., Mellili C., Dann H, and Grant R., Cornell University and William H. Miner Agricultural Research Institute