Some market analysts ARE concerned that butterfat supplies are overabundant, but processors and marketers must keep in mind the butterfat boom continues as the U.S. imported a record 172.6 million pounds of butter and anhydrous milkfat last year. That’s up from 10 million pounds in 2010, based on USDA Economic Research Service data tabulated by CoBank’s Corey Geiger.
4.7 million more acres of corn may be planted in 2025, according to the USDA Prospective Plantings report. If these additional acres are planted, this would total 95.3 million acres of corn planted in the U.S. Soybean planting could be at a five-year low, dropping to 83.5 million acres. If plantings match the survey report, it will mean a decline of 3.6 million soybean acres from 2024.
Looking at price projections for Class III milk, Terrain economist Ben Laine predicts an average $18.15 per cwt. in the second quarter and $17.60 per cwt. in the second half of 2025. “Part of that decline is due to new Federal Milk Marketing Order formulas that will take effect in June. For Class IV, I expect $18.90 per cwt. in Q2, with prices maintaining that same level in the second half of the year,” Laine said. He expects component prices to converge with protein values, increasing by 19% compared with 2024, and butterfat values to fall 13% from last year’s levels.
China slowed imports of skim milk powder (SMP) and whole milk powder (WMP), with January monthly totals hitting their lowest levels since 2013. February was higher, with total imports into China up 16% over 2024. Butter, cheese, and whey imports into China have climbed in the first few months of 2025. China’s dairy imports for the balance of the year remain uncertain, hinging on policies put into place by the government to stimulate economic growth.
Adjusting for the leap year, February milk production for the 24 major reporting states was up 0.9% over the previous year in the USDA’s Milk Production report. Culling continues to decline as the number of cows on farms in the 24 reporting states in February was 8.96 million head — 75,000 head more than February 2024 and 13,000 head more than January 2025.
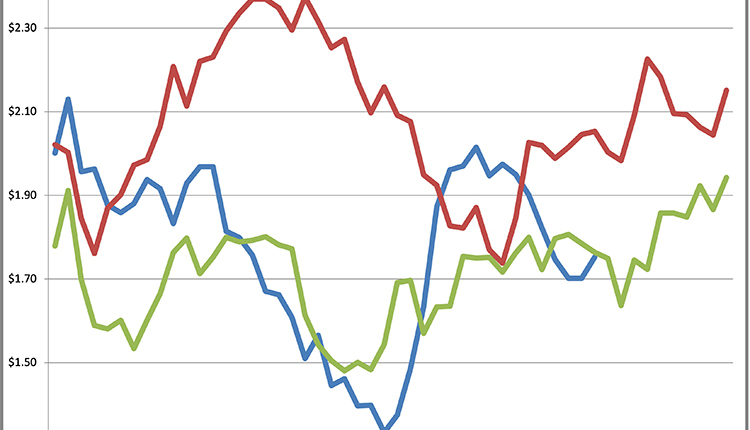
Near term, it’s a buyer’s market on cream with butter churns running at full capacity. That historic cream delivery has become possible due to epic growth in dairy components. When comparing February 2005 to February 2025, butterfat levels have vaulted from 3.7% to 4.4% (see graph below). Meanwhile, protein climbed from 3.06% to 3.4%, according to USDA AMS data.