by Amanda Smith, Hoard's Dairyman Associate Editor
With USDA's NASS (National Agricultural Statistics Service) division sequestration-imposed budget cuts now in effect, February milk production will be the last Milk Production report released for the time being. This report was among the 10 statistical surveys and reports suspended for the remainder of fiscal year 2013 (through September 30).
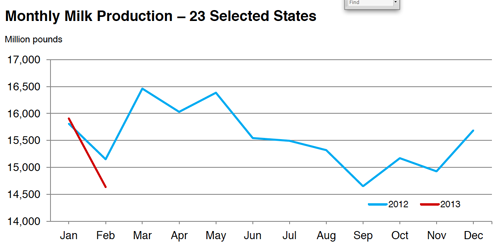
In the 23 major states, February milk production totaled 14.6 billion pounds, down 3.4 percent from February 2012. However, if we compare apples to apples and adjust for 2012's leap year, production rose 0.1 percent. Regardless, February often sees a slight dip in milk production levels compared to other months since it has fewer days.
U.S. milk production in February totaled 15.74 billion pounds, unchanged versus a year ago when leap year adjusted. On an average daily basis, production was 1.9 percent higher than January 2013. Looking at USDA reported values though, January production in the U.S. was 17.1 billion pounds – a 1.4 billion pound reduction in output was seen in February since cows had three fewer days to produce milk.

And this is as far as NASS's milk production graph will take us for the majority of the year.
January production was revised to 15.9 billion pounds, reflecting a 6 million pound gain over previous estimates. Production in January was up 0.6 percent from January 2012 levels, but the adjustment from last month's preliminary estimate only reflected a rise of 0.1 percent.
Total U.S. cow numbers were reported at 9.23 million; 32,000 head below the same period in 2012. The number of cows on farm in the 23 major states was 8.5 million head, 13,000 less than February 2012, but a gain of 2,000 cows from January 2013.
There was a 3.2 percent decline in milk per cow nationwide when compared to the prior year. Compared to February 2012 when cows produced 1,762 pounds of milk, 2013 production shrunk 56 pounds to 1,706 pounds. Production per cow in the 23 major states, averaging 1,722, also dropped 58 pounds below February 2012 levels.
Of the 23 major states, only four saw milk production rise when compared to 2012. These included Kansas, up 3.7; Colorado, 1.6; Michigan, 0.6; and Wisconsin, 0.3. All other states saw declines ranging from slight to severe. Year over year, California was hardest hit, down 8 percent. Other states that declined by 5 percent or more from February 2012 included Arizona, 6.8; Utah, 6.5; Virginia, 5.5; and Texas, 5.4 percent.
With USDA's NASS (National Agricultural Statistics Service) division sequestration-imposed budget cuts now in effect, February milk production will be the last Milk Production report released for the time being. This report was among the 10 statistical surveys and reports suspended for the remainder of fiscal year 2013 (through September 30).
In the 23 major states, February milk production totaled 14.6 billion pounds, down 3.4 percent from February 2012. However, if we compare apples to apples and adjust for 2012's leap year, production rose 0.1 percent. Regardless, February often sees a slight dip in milk production levels compared to other months since it has fewer days.
U.S. milk production in February totaled 15.74 billion pounds, unchanged versus a year ago when leap year adjusted. On an average daily basis, production was 1.9 percent higher than January 2013. Looking at USDA reported values though, January production in the U.S. was 17.1 billion pounds – a 1.4 billion pound reduction in output was seen in February since cows had three fewer days to produce milk.

And this is as far as NASS's milk production graph will take us for the majority of the year.
January production was revised to 15.9 billion pounds, reflecting a 6 million pound gain over previous estimates. Production in January was up 0.6 percent from January 2012 levels, but the adjustment from last month's preliminary estimate only reflected a rise of 0.1 percent.
Total U.S. cow numbers were reported at 9.23 million; 32,000 head below the same period in 2012. The number of cows on farm in the 23 major states was 8.5 million head, 13,000 less than February 2012, but a gain of 2,000 cows from January 2013.
There was a 3.2 percent decline in milk per cow nationwide when compared to the prior year. Compared to February 2012 when cows produced 1,762 pounds of milk, 2013 production shrunk 56 pounds to 1,706 pounds. Production per cow in the 23 major states, averaging 1,722, also dropped 58 pounds below February 2012 levels.
Of the 23 major states, only four saw milk production rise when compared to 2012. These included Kansas, up 3.7; Colorado, 1.6; Michigan, 0.6; and Wisconsin, 0.3. All other states saw declines ranging from slight to severe. Year over year, California was hardest hit, down 8 percent. Other states that declined by 5 percent or more from February 2012 included Arizona, 6.8; Utah, 6.5; Virginia, 5.5; and Texas, 5.4 percent.


