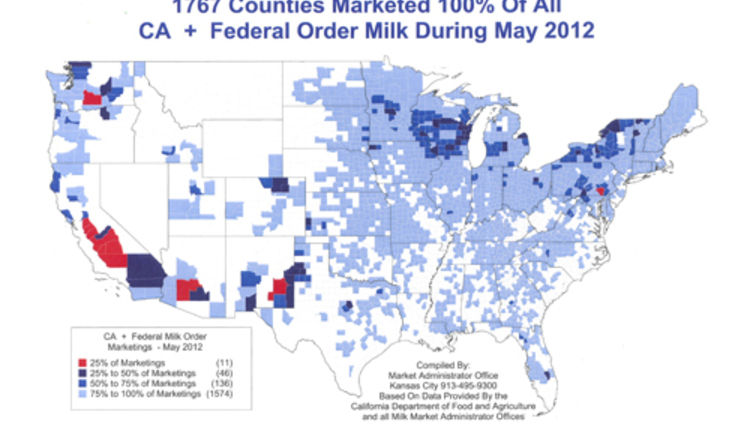
Like many others production sectors, dairy farming continues to evolve into a highly focused segment. In May 2012, there were 1,767 counties that sold milk within the Federal Milk Marketing Order system (FFMO) or in California's statewide milk order. While that may seem like a high number, a much smaller subset accounted for the lion's share of our nation's milk flow.
As a group, 777 of those counties represented growth areas shipping an additional 2.86 billion pounds of milk when comparing data from May 2012 to the same point five year's ago. Meanwhile, 1,157 counties produced less milk than in May 2007. That total reduction was 0.7 billion pounds of milk.
Drilling a little deeper into the data, it took only 11 counties to produce 25 percent of the nation's milk. Of that group, all but one can be found west of the Missouri River in Arizona, California, New Mexico and Washington. The lone East Coast representative was Lancaster County, Pa.

To reach the 75 percent threshold, 193 counties in 26 states met that goal. While these are some solid statistics compiled from the Federal Milk Market Administrator's office in Kansas City, they do not contain all the milk produced in Idaho. At one time, Idaho belonged to a FMMO which made tabulating national milk data much easier. Idaho is now the nation's third-largest dairy state based on milk production.
While county data sheds light onto the consolidating dairy industry, so does a review of farm and production data. "We have reached the 80/20 rule in U.S. milk production," Elanco's Roger Cady told attendees at the International Dairy Foods Association's Dairy Forum on January 29 in Orlando, Fla. "Eighty percent of the milk comes from the 10,000 largest farms," he explained. "Also, 50 percent of the production comes from the 2,500 largest U.S. dairy farms," noted Cady.
While that insight gives us a look at the entire U.S. dairy industry, it does not break out the small but growing organic sector. In 2011, the U.S. had 51,481 dairy farms with permits to sell milk. Those farms had 9.2 million dairy cows. Of the nation's dairy farms, USDA estimates 1,823 of them are organic operations with nearly 200,000 cows. That is 3.5 percent of the operations and 2.2 percent of the cows.
If the organic dairy category was pulled out of the conventional farms, the 80/20 rule discussed by Cady wouldn't be quite as dramatic, but it would still be very close. And based on industry trend lines, these ratios should continue to get tighter as more dairy farms exit our industry.
Click here for a printable version of the map
As a group, 777 of those counties represented growth areas shipping an additional 2.86 billion pounds of milk when comparing data from May 2012 to the same point five year's ago. Meanwhile, 1,157 counties produced less milk than in May 2007. That total reduction was 0.7 billion pounds of milk.
Drilling a little deeper into the data, it took only 11 counties to produce 25 percent of the nation's milk. Of that group, all but one can be found west of the Missouri River in Arizona, California, New Mexico and Washington. The lone East Coast representative was Lancaster County, Pa.

To reach the 75 percent threshold, 193 counties in 26 states met that goal. While these are some solid statistics compiled from the Federal Milk Market Administrator's office in Kansas City, they do not contain all the milk produced in Idaho. At one time, Idaho belonged to a FMMO which made tabulating national milk data much easier. Idaho is now the nation's third-largest dairy state based on milk production.
While county data sheds light onto the consolidating dairy industry, so does a review of farm and production data. "We have reached the 80/20 rule in U.S. milk production," Elanco's Roger Cady told attendees at the International Dairy Foods Association's Dairy Forum on January 29 in Orlando, Fla. "Eighty percent of the milk comes from the 10,000 largest farms," he explained. "Also, 50 percent of the production comes from the 2,500 largest U.S. dairy farms," noted Cady.
While that insight gives us a look at the entire U.S. dairy industry, it does not break out the small but growing organic sector. In 2011, the U.S. had 51,481 dairy farms with permits to sell milk. Those farms had 9.2 million dairy cows. Of the nation's dairy farms, USDA estimates 1,823 of them are organic operations with nearly 200,000 cows. That is 3.5 percent of the operations and 2.2 percent of the cows.
If the organic dairy category was pulled out of the conventional farms, the 80/20 rule discussed by Cady wouldn't be quite as dramatic, but it would still be very close. And based on industry trend lines, these ratios should continue to get tighter as more dairy farms exit our industry.
Click here for a printable version of the map


