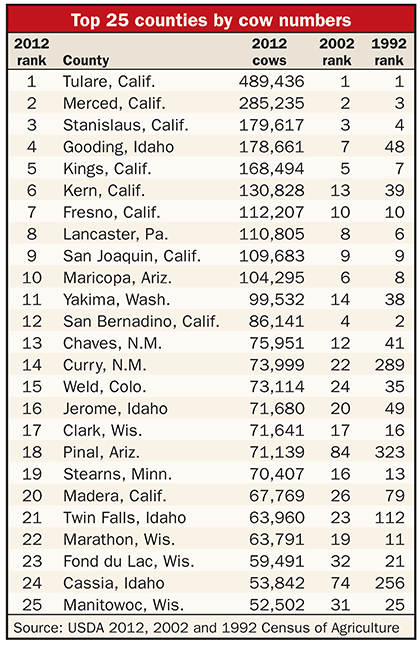
With 489,436 cows in the most recent U.S. Census of Agriculture, Tulare County retained its title as the nation's largest dairy county. In fact, if the California dairy hotbed were a state to itself, it would rank sixth and be wedged between Pennsylvania and Minnesota with 5.3 percent of the nation's cows.

Not only did Tulare County maintain its stronghold as the nation's most populated dairy county, it also expanded its lead over second-place Merced County by adding nearly 15,000 cows between the five-year census surveys, which was 3,000 more than its closest competitor.
Eight more of Tulare's Golden State neighbors are on the top 25, list shown in the table to the right. Those nine counties reveal a similar pattern that is taking place around the country, as counties are either growing or shedding cow numbers. Among the top 25 U.S. dairy counties, California was home to five that grew their herd size by an average of 7,649 cows per county. Meanwhile, the remaining four lost an average of 11,916 head each.
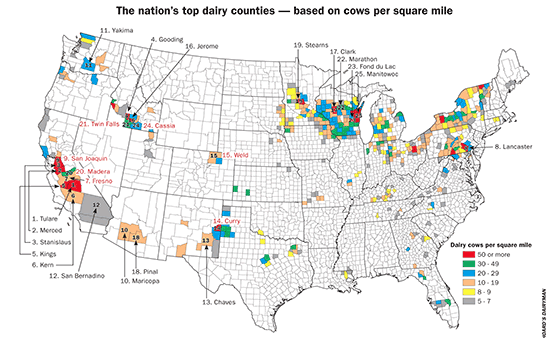
That intensity, defined by dairy cows per square mile, can be observed in the map below. Next to California, only Wisconsin is home to more counties with over 50 cows per square mile. In particular, seven of Wisconsin's eight most densely populated counties are located in the northeast portion of the state. Over the past five years, that group has expanded its collective herd size by 5,386 per county paced by Fond du Lac's 12,000 cows and closely followed by Kewaunee at 10,500.
During the last five years, a similar situation has transpired in the Texas Panhandle and eastern New Mexico. In that 10-county cluster, seven counties experienced a significant expansion growing by an average of 11,171 cows. That area was paced by the following counties over the most recent five-year window: Hartley, Texas, 17,495; Lamb, Texas, 17,084; Lea, N.M., 11,510; and Curry, N.M., 10,116. In that same region, Deaf Smith County, Texas, held its own, while Parmer, Texas, was down 2,900. Roosevelt, N.M, lost 10,200 cows.
Nationwide, other counties that added 10,000 or more cows over the past five years included: Gooding, Idaho, which posted the nation's largest gain at 38,290; Morrow, Ore., 10,800; and Huron, Mich., with 10,200. A two-county duo in western Kansas added nearly 40,000 cows paced by Gray's 26,400 and Hamilton's 13,900.
Southern California's San Bernardino lost 24,000 head to notch the largest reduction while its northern counterpart, Stanislaus, culled 12,100 head. Erath County in eastern Texas was wedged in between them losing 15,800 head.
In all, 32 percent of dairy cows reside in the top 25 counties. Those numbers are up 4 percent from 2002's 28 percent and up 12 percent from 1992's 20 percent.
When expanding the list to the top 50 counties, 46 percent of the nation's dairy cows resided in the top 50 compared to 30 percent just 20 years ago. In 2012, 57 percent of all milking bovines were in the top 100 counties compared to 42 percent two decades earlier.
The map below shows current cow densities. The numbers (1 to 25) found on the map correspond to the top 25 counties shown in the table. The color scale at the bottom of the map details cows per square mile.

This article appears on page 487 of the August 10, 2014 issue of Hoard's Dairyman.

Not only did Tulare County maintain its stronghold as the nation's most populated dairy county, it also expanded its lead over second-place Merced County by adding nearly 15,000 cows between the five-year census surveys, which was 3,000 more than its closest competitor.
Eight more of Tulare's Golden State neighbors are on the top 25, list shown in the table to the right. Those nine counties reveal a similar pattern that is taking place around the country, as counties are either growing or shedding cow numbers. Among the top 25 U.S. dairy counties, California was home to five that grew their herd size by an average of 7,649 cows per county. Meanwhile, the remaining four lost an average of 11,916 head each.
That intensity, defined by dairy cows per square mile, can be observed in the map below. Next to California, only Wisconsin is home to more counties with over 50 cows per square mile. In particular, seven of Wisconsin's eight most densely populated counties are located in the northeast portion of the state. Over the past five years, that group has expanded its collective herd size by 5,386 per county paced by Fond du Lac's 12,000 cows and closely followed by Kewaunee at 10,500.
During the last five years, a similar situation has transpired in the Texas Panhandle and eastern New Mexico. In that 10-county cluster, seven counties experienced a significant expansion growing by an average of 11,171 cows. That area was paced by the following counties over the most recent five-year window: Hartley, Texas, 17,495; Lamb, Texas, 17,084; Lea, N.M., 11,510; and Curry, N.M., 10,116. In that same region, Deaf Smith County, Texas, held its own, while Parmer, Texas, was down 2,900. Roosevelt, N.M, lost 10,200 cows.
Nationwide, other counties that added 10,000 or more cows over the past five years included: Gooding, Idaho, which posted the nation's largest gain at 38,290; Morrow, Ore., 10,800; and Huron, Mich., with 10,200. A two-county duo in western Kansas added nearly 40,000 cows paced by Gray's 26,400 and Hamilton's 13,900.
Southern California's San Bernardino lost 24,000 head to notch the largest reduction while its northern counterpart, Stanislaus, culled 12,100 head. Erath County in eastern Texas was wedged in between them losing 15,800 head.
In all, 32 percent of dairy cows reside in the top 25 counties. Those numbers are up 4 percent from 2002's 28 percent and up 12 percent from 1992's 20 percent.
When expanding the list to the top 50 counties, 46 percent of the nation's dairy cows resided in the top 50 compared to 30 percent just 20 years ago. In 2012, 57 percent of all milking bovines were in the top 100 counties compared to 42 percent two decades earlier.
The map below shows current cow densities. The numbers (1 to 25) found on the map correspond to the top 25 counties shown in the table. The color scale at the bottom of the map details cows per square mile.


