The author is vice president, economic policy and research, National Milk Producers Federation.
From the time milk leaves the cows until the time it leaves the farm, dairy farmers see the milk they produce as a single liquid product. But they know that it's actually a complex package of components that is increasingly separated into ingredients. Those components produce a growing variety of food products sold in an ever-widening variety of markets at home and around the world.
The price each dairy producer receives for their milk is the end result of the forces of supply and demand in those many markets. This past year likely heightened dairy farmers' awareness of this reality because 2015 was a year of exceptional extremes in these markets, with a major fault line running right between the milkfat and the skim solids components of their milk.

Record high . . . record lows
Here are some simple comparisons from the almost 16-year history of monthly federal order class and component prices. Also included are the national surveys of product prices from which those class and component prices are computed under the federal order pricing formulas. This is what happened during the last five months of 2015:
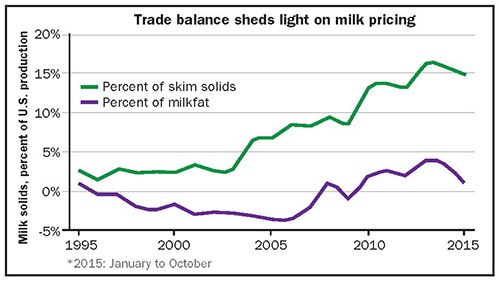
The graph provides an important clue. It shows the U.S. dairy trade balance - exports minus imports - for skim solids and for milkfat in all traded products. Both items are expressed as a percent of total U.S. domestic production of that component. During the more than two decades shown, the United States has exported an almost steadily and growing proportion of its skim milk solids production, reaching net exports of over 15 percent in recent years.
Contributing significantly to this situation has been nonfat dry milk, skim milk powder and dry whey, of which more than half of U.S. production is now being exported. By contrast, the U.S. has never been a net exporter of more than 4 percent of its milkfat production and was a net importer of milkfat for more than half this period. While exports of both milk components have declined during the past two years, the difference between the U.S. trade balances for skim milk solids and for milkfat has reached its highest ever level, almost 14 percent of their respective production, during 2015.
This means that U.S.-produced skim milk solids are now being priced primarily in the world market, while U.S.-produced milkfat is being priced in the U.S. domestic market. The steep drop in world dairy product prices during 2014 took U.S. nonfat dry milk and dry whey prices with them, and those prices have remained at depressed levels ever since.
Fat the new health food
By contrast, domestic consumer attitudes have grown more favorable toward consuming dietary fat, stimulating greater demand for a wide variety of dairy products, including whole milk, full-fat yogurt, higher-fat cheeses, as well as butter. Coupled with slowing growth in U.S. milk and milkfat production, this has driven milkfat prices to record levels and reduced the amount of U.S.-produced milkfat available to export.
It has also created an excellent environment for NMPF's Cooperatives Working Together (CWT) export assistance program to have a substantial impact on dairy producer incomes. CWT focuses on the milkfat-containing products, and its history of export assistance tracks the U.S. move from a negative to a positive milkfat trade balance shown in the chart. CWT-assisted exports of butter, cheese and whole milk powder moved the equivalent of about 1.5 billion pounds of U.S. milk production, measured on the basis of milkfat, to overseas markets in 2015.
Recent record-low skim values have been partially offset by the record-high milkfat values in the typical U.S. farm milk check. The estimated proportion of the monthly national average All-Milk price contributed by the milkfat component hit an all-time high late last year of about two-thirds of the total price. Prior to 2015, this proportion averaged just over one-third.
In other words, late last year dairy farmers' milk checks were roughly twice as dependent on the price of a single dairy product, butter, as they have generally been in all previous years - and were also twice as dependent on the price of butter as they were on all three other product prices combined.
More of the same
The pricing trends of 2015 will likely continue to some extent during this year. Year-over-year growth in total U.S. milk production came almost to a halt toward the end of 2015, as annual rates of change declined throughout the year in virtually all states, regardless of whether their growth was positive or negative. These trends will likely make 2016 another year of a very small, if any, increase in national milk production. That scenario keeps milkfat production tight and prices firm.
Consumers' growing taste for milkfat is likely to be more than just a short-term trend. The CME dairy futures at the end of 2015 indicated that butter prices would remain above $2 a pound during every month of 2016, but averaged just barely more than that during 2015. Meanwhile, Cheddar cheese prices would average just about the same in both years. The end-of-year futures also indicated that, compared with 2015, nonfat dry milk prices in 2016 would average about 10 cents a pound more but dry whey prices would average about 10 cents a pound less.
This forecast is consistent with world dairy market analysts' estimates that recovery of world dairy product prices will continue to be slow. From the futures, the All-Milk price in 2016 could be projected to average close to 2015's level, with the milkfat value representing about 55 percent of the total milk price. That is, butter will continue to play a larger-than-usual role in this year's milk checks.
This article appears on page 91 of the February 10, 2016 issue of Hoard's Dairyman.
Return to the Hoard's Dairyman feature page.
From the time milk leaves the cows until the time it leaves the farm, dairy farmers see the milk they produce as a single liquid product. But they know that it's actually a complex package of components that is increasingly separated into ingredients. Those components produce a growing variety of food products sold in an ever-widening variety of markets at home and around the world.
The price each dairy producer receives for their milk is the end result of the forces of supply and demand in those many markets. This past year likely heightened dairy farmers' awareness of this reality because 2015 was a year of exceptional extremes in these markets, with a major fault line running right between the milkfat and the skim solids components of their milk.

Record high . . . record lows
Here are some simple comparisons from the almost 16-year history of monthly federal order class and component prices. Also included are the national surveys of product prices from which those class and component prices are computed under the federal order pricing formulas. This is what happened during the last five months of 2015:
- The monthly survey price for butter, and hence the monthly federal order component price for butterfat, attained their second-, third- and fourth-highest levels ever.
- The monthly survey price for nonfat dry milk and the monthly federal order component prices for nonfat solids and Class IV skim milk hit record lows for three months.
- The monthly survey price for dry whey and the monthly federal order component price for other solids reached their lowest, second-lowest and third-lowest levels since early 2009.
- The monthly federal order component price for protein and the federal order Class III skim price reached their third- and fourth-lowest levels ever.
- The monthly federal order component price for butterfat exceeded both the monthly nonfat solids price and the monthly protein price by record levels for four straight months.
The graph provides an important clue. It shows the U.S. dairy trade balance - exports minus imports - for skim solids and for milkfat in all traded products. Both items are expressed as a percent of total U.S. domestic production of that component. During the more than two decades shown, the United States has exported an almost steadily and growing proportion of its skim milk solids production, reaching net exports of over 15 percent in recent years.
Contributing significantly to this situation has been nonfat dry milk, skim milk powder and dry whey, of which more than half of U.S. production is now being exported. By contrast, the U.S. has never been a net exporter of more than 4 percent of its milkfat production and was a net importer of milkfat for more than half this period. While exports of both milk components have declined during the past two years, the difference between the U.S. trade balances for skim milk solids and for milkfat has reached its highest ever level, almost 14 percent of their respective production, during 2015.
This means that U.S.-produced skim milk solids are now being priced primarily in the world market, while U.S.-produced milkfat is being priced in the U.S. domestic market. The steep drop in world dairy product prices during 2014 took U.S. nonfat dry milk and dry whey prices with them, and those prices have remained at depressed levels ever since.
Fat the new health food
By contrast, domestic consumer attitudes have grown more favorable toward consuming dietary fat, stimulating greater demand for a wide variety of dairy products, including whole milk, full-fat yogurt, higher-fat cheeses, as well as butter. Coupled with slowing growth in U.S. milk and milkfat production, this has driven milkfat prices to record levels and reduced the amount of U.S.-produced milkfat available to export.
It has also created an excellent environment for NMPF's Cooperatives Working Together (CWT) export assistance program to have a substantial impact on dairy producer incomes. CWT focuses on the milkfat-containing products, and its history of export assistance tracks the U.S. move from a negative to a positive milkfat trade balance shown in the chart. CWT-assisted exports of butter, cheese and whole milk powder moved the equivalent of about 1.5 billion pounds of U.S. milk production, measured on the basis of milkfat, to overseas markets in 2015.
Recent record-low skim values have been partially offset by the record-high milkfat values in the typical U.S. farm milk check. The estimated proportion of the monthly national average All-Milk price contributed by the milkfat component hit an all-time high late last year of about two-thirds of the total price. Prior to 2015, this proportion averaged just over one-third.
In other words, late last year dairy farmers' milk checks were roughly twice as dependent on the price of a single dairy product, butter, as they have generally been in all previous years - and were also twice as dependent on the price of butter as they were on all three other product prices combined.
More of the same
The pricing trends of 2015 will likely continue to some extent during this year. Year-over-year growth in total U.S. milk production came almost to a halt toward the end of 2015, as annual rates of change declined throughout the year in virtually all states, regardless of whether their growth was positive or negative. These trends will likely make 2016 another year of a very small, if any, increase in national milk production. That scenario keeps milkfat production tight and prices firm.
Consumers' growing taste for milkfat is likely to be more than just a short-term trend. The CME dairy futures at the end of 2015 indicated that butter prices would remain above $2 a pound during every month of 2016, but averaged just barely more than that during 2015. Meanwhile, Cheddar cheese prices would average just about the same in both years. The end-of-year futures also indicated that, compared with 2015, nonfat dry milk prices in 2016 would average about 10 cents a pound more but dry whey prices would average about 10 cents a pound less.
This forecast is consistent with world dairy market analysts' estimates that recovery of world dairy product prices will continue to be slow. From the futures, the All-Milk price in 2016 could be projected to average close to 2015's level, with the milkfat value representing about 55 percent of the total milk price. That is, butter will continue to play a larger-than-usual role in this year's milk checks.


