The author is a dairy economist with Downes O'Neill/FC Stone, LLC, Dearborn, Mo.
USDA's release of the World Agricultural Supply and Demand Estimates (WASDE) report in mid-February provided neutral to slightly negative news for U.S. dairy producers. On the input side, feed costs could be lower this year than in 2015. If realized, this would be the fourth year in a row that feed prices have dropped.
On the other side of the equation, the U.S. All-Milk price midpoint is projected to be $15.65 per hundredweight, down $1.43 from last year's price level. Even with the drop, if the 2016 All-Milk price is realized, it would be the tenth highest in history. However, the fact remains that the All-Milk price will be down $8.32 per hundredweight from the record high of $23.97 set in 2014. That means the reduction in milk prices is not completely offset by the drop in feed costs, but the decline in income over feed costs for dairy producers will still not result in margins as low as 2009 or 2012. The general market as represented by the Chicago Mercantile Exchange (CME) futures prices are more optimistic than USDA when it comes to dairy producer profitability.
Lower margins prevail
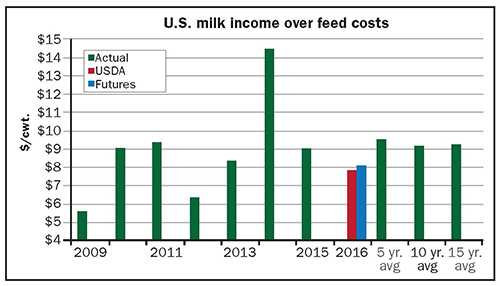
Using USDA's marketing year midpoint projections for corn and soybeans, plus my rough estimate for alfalfa hay, the 2016 feed costs are projected to be $7.81 per hundredweight. When USDA's feed costs are combined with its calendar year All-Milk midpoint price projection of $15.65, income over feed comes in at $7.84 per hundredweight. That is $1.18 below 2015's level of $9.02 and $1.67 lower than the five-year average of $9.51 per hundredweight.
Looking at another source for prices, the CME futures market, a higher result is expected. Using the February 9 futures settling prices for corn and soybeans, plus my rough estimate for alfalfa hay, the 2016 feed costs are projected to be $7.91 per hundredweight. When USDA's $1.25 per hundredweight difference between its 2016 All-Milk and Class III milk price estimates are added to the February 9 CME Class III milk price settling futures prices of $14.77, the resulting All-Milk price projection is $16.02. The resulting CME futures price-based income over feed comes in at $8.11 per hundredweight. That is 91 cents below 2015's level and $1.40 lower than the five-year average of $9.51 per hundredweight.

With U.S. milk income over feed costs estimated to be below average, but above the level to keep milk production steady to growing, gains in milk production should be close to average as well. That is exactly what USDA is estimating with their projected milk production estimate of 211.9 billion pounds, a gain of 1.6 percent over 2015's record milk flow. The five-year average growth in milk production is 1.6 percent.
The gain in milk production will probably be more heavily weighted toward the last half of 2016, as opposed to the first half of this year. This is due to the lack of strong milk production growth during that same period of time in 2015, as milk cow numbers were rising slowly and milk per cow was barely positive.
Weather across portions of the country the past two months or so has been very negative for cow comfort. However, the potential losses of milk supplies in those areas will more than likely be offset by fairly benign weather in the rest of the country.
Many more heifers
The timing of the milk production gains will also be impacted by a decent number of dairy heifers entering the herd this year. Dairy heifers . . . 3.1 million expected to calve this coming year . . . are pegged at their highest level since USDA-NASS started to track the category in 2001. The inventory level for 2016 grew more than one would have expected given the profitability in 2015, but the carryover from the record profitability of 2014 was a heavy influence in the retention of replacement heifers.
High beef prices did not seem to play much of a role in culling and heifer retention in 2015. Now that beef prices have dropped, dairy producers face a much different financial picture with regards to culling than they have for the past few years, and that could keep a few more dairy cows in the herd as well.

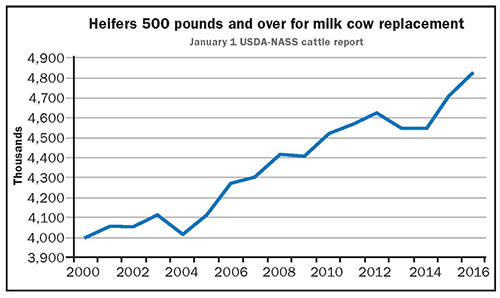
The supply of dairy replacement heifers 500 pounds or greater has grown since January 1, 2015, according to USDA-NASS's Cattle Report for January 1, 2016. This wider group of heifers has been estimated at 4.8 million head, up 2.4 percent from last year. Of the 4.8 million head of replacement heifers, 3.1 million are expected to calve in 2016. This is 64.6 percent of the total replacement heifer inventory and 33.5 percent of the milk herd. Again, that number represents the highest level since the data series started in 2001.
Last year's dairy replacement heifers estimate was raised 95,000 head to 4.7 million head, which is 3.6 percent above levels from two years ago. The number of heifers expected to have calved in 2015 was raised 54,000 head to 3.05 million. That placed the heifers expected to calve in 2015 at 64.8 percent of the total heifer inventory and 32.8 percent of the milk herd.
For milk cows that have calved, USDA-NASS estimates the 2016 herd size to be 9.32 million head, up 0.1 percent from 2015. Last year's milk herd was left unchanged at 9.31 million head. With the milk herd up less than replacement heifers, the percentage of replacement heifers to milk cows rose for 2016 compared to 2015. The 2016 percentage of heifers over 500 pounds to milk cows is 51.8 percent, the second year ever over 50 percent.
Fourth quarter U.S. economic growth was up 0.7 percent, which was down from the third quarter's 2.0 percent growth rate. U.S. employment continues to grow, with 151,000 jobs added in January, and wages moved higher indicating that the labor pool could be starting to tighten. Nine of the past 13 months have recorded gains of over 200,000 positions.
More employees, more sales
From a domestic standpoint, the growth in employment will help domestic dairy demand, and that will be needed to offset expected higher supplies and lower exports in 2016. Total dairy export volumes are declining, and that will continue into 2016.
Meanwhile, food price inflation slowed last year and recorded its smallest gain in December, dropping below the 1 percent growth level for the first time since August 2010.
The last time that food inflation was negative was February 2010, and it is not out of the question that it could turn negative before 2016 is over. Helping to pull overall food inflation down has been dairy products, which have shown negative growth levels since April 2015. Gasoline prices have been lower, and according to the U.S. Energy Information Administration, the average U.S. driver will pay below $2 per gallon of gasoline this year for the first time since 2004. This will provide a large windfall to driving consumers that can be spent on other consumables, like dairy products.
Murky elsewhere
The outlook is clouded by the slowdown in China and has reemerged as the focal point for the global economy. The dropping value of the yuan and weaker stock valuations in China spilled over into the rest of the world, causing further drops in commodity prices and stock markets. There has been some rebound in values, but not with enough ferocity to provide much comfort to traders.
In Europe, the continuing refuge crisis, and its economic implications, is garnering most of the attention. The Federal Reserve has indicated that it is still on track for additional interest rate hikes, but the weakening of international markets could derail those plans.
While the 2016 outlook for dairy producers is down, not as good as 2015 ended up, it still looks to be a decent year that should allow most dairy producers to maintain their balance sheets.
This article appears on page 159 of the March 10, 2015 issue of Hoard's Dairyman.
Return to the Hoard's Dairyman feature page.
USDA's release of the World Agricultural Supply and Demand Estimates (WASDE) report in mid-February provided neutral to slightly negative news for U.S. dairy producers. On the input side, feed costs could be lower this year than in 2015. If realized, this would be the fourth year in a row that feed prices have dropped.
On the other side of the equation, the U.S. All-Milk price midpoint is projected to be $15.65 per hundredweight, down $1.43 from last year's price level. Even with the drop, if the 2016 All-Milk price is realized, it would be the tenth highest in history. However, the fact remains that the All-Milk price will be down $8.32 per hundredweight from the record high of $23.97 set in 2014. That means the reduction in milk prices is not completely offset by the drop in feed costs, but the decline in income over feed costs for dairy producers will still not result in margins as low as 2009 or 2012. The general market as represented by the Chicago Mercantile Exchange (CME) futures prices are more optimistic than USDA when it comes to dairy producer profitability.
Lower margins prevail
Using USDA's marketing year midpoint projections for corn and soybeans, plus my rough estimate for alfalfa hay, the 2016 feed costs are projected to be $7.81 per hundredweight. When USDA's feed costs are combined with its calendar year All-Milk midpoint price projection of $15.65, income over feed comes in at $7.84 per hundredweight. That is $1.18 below 2015's level of $9.02 and $1.67 lower than the five-year average of $9.51 per hundredweight.
Looking at another source for prices, the CME futures market, a higher result is expected. Using the February 9 futures settling prices for corn and soybeans, plus my rough estimate for alfalfa hay, the 2016 feed costs are projected to be $7.91 per hundredweight. When USDA's $1.25 per hundredweight difference between its 2016 All-Milk and Class III milk price estimates are added to the February 9 CME Class III milk price settling futures prices of $14.77, the resulting All-Milk price projection is $16.02. The resulting CME futures price-based income over feed comes in at $8.11 per hundredweight. That is 91 cents below 2015's level and $1.40 lower than the five-year average of $9.51 per hundredweight.

With U.S. milk income over feed costs estimated to be below average, but above the level to keep milk production steady to growing, gains in milk production should be close to average as well. That is exactly what USDA is estimating with their projected milk production estimate of 211.9 billion pounds, a gain of 1.6 percent over 2015's record milk flow. The five-year average growth in milk production is 1.6 percent.
The gain in milk production will probably be more heavily weighted toward the last half of 2016, as opposed to the first half of this year. This is due to the lack of strong milk production growth during that same period of time in 2015, as milk cow numbers were rising slowly and milk per cow was barely positive.
Weather across portions of the country the past two months or so has been very negative for cow comfort. However, the potential losses of milk supplies in those areas will more than likely be offset by fairly benign weather in the rest of the country.
Many more heifers
The timing of the milk production gains will also be impacted by a decent number of dairy heifers entering the herd this year. Dairy heifers . . . 3.1 million expected to calve this coming year . . . are pegged at their highest level since USDA-NASS started to track the category in 2001. The inventory level for 2016 grew more than one would have expected given the profitability in 2015, but the carryover from the record profitability of 2014 was a heavy influence in the retention of replacement heifers.
High beef prices did not seem to play much of a role in culling and heifer retention in 2015. Now that beef prices have dropped, dairy producers face a much different financial picture with regards to culling than they have for the past few years, and that could keep a few more dairy cows in the herd as well.

The supply of dairy replacement heifers 500 pounds or greater has grown since January 1, 2015, according to USDA-NASS's Cattle Report for January 1, 2016. This wider group of heifers has been estimated at 4.8 million head, up 2.4 percent from last year. Of the 4.8 million head of replacement heifers, 3.1 million are expected to calve in 2016. This is 64.6 percent of the total replacement heifer inventory and 33.5 percent of the milk herd. Again, that number represents the highest level since the data series started in 2001.
Last year's dairy replacement heifers estimate was raised 95,000 head to 4.7 million head, which is 3.6 percent above levels from two years ago. The number of heifers expected to have calved in 2015 was raised 54,000 head to 3.05 million. That placed the heifers expected to calve in 2015 at 64.8 percent of the total heifer inventory and 32.8 percent of the milk herd.
For milk cows that have calved, USDA-NASS estimates the 2016 herd size to be 9.32 million head, up 0.1 percent from 2015. Last year's milk herd was left unchanged at 9.31 million head. With the milk herd up less than replacement heifers, the percentage of replacement heifers to milk cows rose for 2016 compared to 2015. The 2016 percentage of heifers over 500 pounds to milk cows is 51.8 percent, the second year ever over 50 percent.
Fourth quarter U.S. economic growth was up 0.7 percent, which was down from the third quarter's 2.0 percent growth rate. U.S. employment continues to grow, with 151,000 jobs added in January, and wages moved higher indicating that the labor pool could be starting to tighten. Nine of the past 13 months have recorded gains of over 200,000 positions.
More employees, more sales
From a domestic standpoint, the growth in employment will help domestic dairy demand, and that will be needed to offset expected higher supplies and lower exports in 2016. Total dairy export volumes are declining, and that will continue into 2016.
Meanwhile, food price inflation slowed last year and recorded its smallest gain in December, dropping below the 1 percent growth level for the first time since August 2010.
The last time that food inflation was negative was February 2010, and it is not out of the question that it could turn negative before 2016 is over. Helping to pull overall food inflation down has been dairy products, which have shown negative growth levels since April 2015. Gasoline prices have been lower, and according to the U.S. Energy Information Administration, the average U.S. driver will pay below $2 per gallon of gasoline this year for the first time since 2004. This will provide a large windfall to driving consumers that can be spent on other consumables, like dairy products.
Murky elsewhere
The outlook is clouded by the slowdown in China and has reemerged as the focal point for the global economy. The dropping value of the yuan and weaker stock valuations in China spilled over into the rest of the world, causing further drops in commodity prices and stock markets. There has been some rebound in values, but not with enough ferocity to provide much comfort to traders.
In Europe, the continuing refuge crisis, and its economic implications, is garnering most of the attention. The Federal Reserve has indicated that it is still on track for additional interest rate hikes, but the weakening of international markets could derail those plans.
While the 2016 outlook for dairy producers is down, not as good as 2015 ended up, it still looks to be a decent year that should allow most dairy producers to maintain their balance sheets.


