On the other side of the equation, the U.S. All-Milk price midpoint projection slid to $18.25 per hundredweight (cwt.), down 60 cents from the February 2020 projection due to concerns surrounding the coronavirus. If realized, that All-Milk price would be off 35 per cwt. from 2019’s price level.
A mixed bag
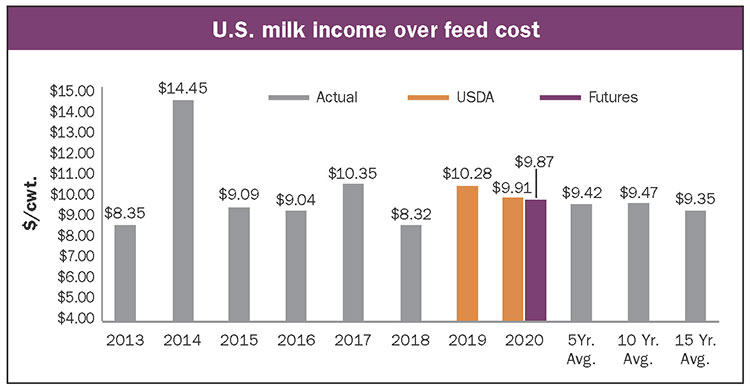
When factoring in the milk price forecast with the slight uptick in feed costs, income over feed costs for dairy producers slides to $9.91 . . . compared to $10.28 in 2019. The general market, as represented by the Chicago Mercantile Exchange (CME) futures prices, are slightly lower than USDA when it comes to dairy producer profitability.

Using USDA’s marketing year midpoint projections for corn and soybeans, plus my rough estimate for alfalfa hay, the 2020 feed costs are projected to be $8.34 per cwt. When USDA’s feed costs are combined with their calendar year All-Milk midpoint price projection of $18.25, income over feed comes in at $9.91 per hundredweight. That is 37 cents below 2019’s level of $10.28 and 49 cents higher than the 2015 to 2019 five-year average of $9.42 per hundredweight.
Looking at another source for prices, the CME futures market, the result is similar. Using the March 10 futures settling prices for corn and soybeans, plus my rough estimate for alfalfa hay, the 2020 feed costs are projected to be $8.35 per cwt. When USDA’s $1.60 per cwt. difference between their 2020 All-Milk and Class III milk price estimates are added to the March 10 CME Class III milk price settling futures prices of $16.62, the resulting All-Milk price projection is $18.22.
The resulting CME futures price, based on income over feed costs, comes in at $9.87 per cwt. That would be 41 cents per cwt. below 2019’s estimated level, but 45 cents higher than the 2015 to 2019 five-year average of $9.42 per cwt.
With U.S. milk income over feed costs estimated to be above average, and above the level needed to keep milk production growing, gains in milk production can be expected to be close to or above average. That is exactly what USDA is estimating with their projected milk production of 222.3 billion pounds, a gain of 1.5% on a daily basis over 2019’s milk production level. The five-year average increase in milk production is 1.2%.
The gain in milk production will probably be more heavily weighted toward the first half of 2019, as opposed to the last half. This will be due to the lagging response in milk production to higher dairy farm profitability.
As profitability improves, culling of milk cows will diminish, resulting in an accelerating rate of growth in milk production. There also could be a possible expansion of the national dairy herd, which has shown some signs of coming to pass with a gain of 22,000 head since the low point of August 2019 at 9.317 million head. Feed quality for dairy cows may negatively impact milk production in the first half of the year until the early harvests of 2020 are complete.
Heifer impacts
According to USDA-NASS’s Cattle Report for January 1, 2020, the dairy replacement heifer population has shrunk since January 1, 2019. Dairy replacement heifers over 500 pounds are estimated to number 4.637 million head, down 1.4% from 2019. This was the second year of 1.4% declines in the replacement inventory and the third year of the past four that the heifer inventory has declined.
Of the 4.637 million head of replacement heifers, 2.931 million are expected to calve in 2020. This is 63.2% of the total replacement heifer inventory and 31.4% of the milk herd, the fourteenth highest percentage since the data series started in 2001.
A year of opportunity
For milk cows that have calved, USDA-NASS estimates the 2020 herd size to be 9.335 million head, down 0.2% from 2019. Last year’s milk herd was left unchanged at 9.353 million head. With the milk herd down less than replacement heifers, the percentage of replacement heifers to milk cows dropped below 50% for the first time since 2014. The 2020 percentage of heifers to milk cows is 49.7%.
Not surprisingly, the top annual milk production dairy states also have the most heifers. California leads the country with 750,000 head, down 10,000 head from 2019. Wisconsin is second with 690,000 head, up 10,000 head from 2019, and New York is third at 345,000, up 10,000 head.
Rounding out the top five are Idaho at 330,000, down 10,000 head, and Pennsylvania at 275,000 head, down 15,000 head. Nebraska and New Mexico showed the largest gains in heifers with a 15,000-head increase, while Kansas and Minnesota showed the largest declines, down 30,000 head.
In general, the 2020 outlook for dairy producers is expected to be similar to 2019. That’s because of growing concerns about dairy product sales due to the coronavirus. Profitability is not expected to be drastically above the level needed to maintain or grow milk production in any one month. As a result, it is a year that could provide some dairy producers the opportunity to strengthen their balance sheets.


