But looking at all 24 years for which licensed dairy farm numbers exist, and then projecting where the decline trend may be headed, is a real wakeup call about the industry future. Here are some figures to consider:
- The number of dairy farms in the U.S. in 2016 was just slightly more than the number of undergraduate students at Penn State University (40,451). Three public colleges, by the way, had more students than there are dairy farms.
- Since 1992 when the number of licensed dairies (131,535) was first published, the U.S. total has fallen by 68.2 percent.
- The biggest statewide declines have occurred in North Dakota (-94.4 percent) and Arkansas (-93.1 percent). South Dakota, Wyoming, Mississippi, Alabama, and Nebraska have all lost at least 88 percent of their dairies.
- By far the slowest regional decline since 1992 has been in the Northeast (-55.2 percent).
- Only one state has increased dairy farm numbers since 1992 – New Mexico with 16. However, it stopped growing several years ago. It had one less dairy in 2016 (150) than it did 20 years ago.
- Wisconsin has lost the most dairies on a total number basis since 1992 – 21,766.
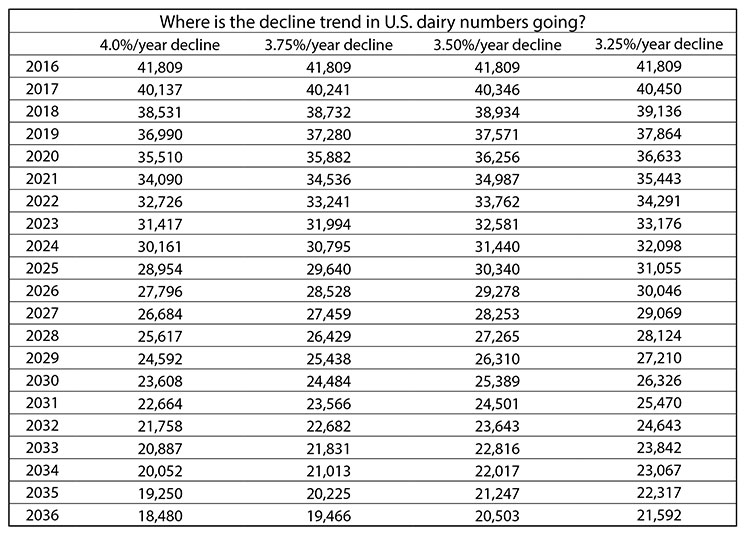
- The percentage rate of decline in U.S. dairy numbers has slowed during the last decade and has averaged 4.0 percent for the last five years.
“Fewer dairies each year” is the easiest of all predictions to make about the dairy industry. But just like compounding interest rates for money, the effect of a compounding decline rates for farm numbers is eye-opening.
For instance, a 4.0 percent rate of decline for 20 years means there would be just 18,480 dairies left in the U.S. in 2036.
Even if the rate of decline were to slow significantly to just 3.25 percent per year, there would be only 21,592 dairies left in 20 years.
The dairy industry is clearly on track to have only half as many farms as it does today. The only question is which year during the 2030s it will happen.
To comment, email your remarks to intel@hoards.com.


