Change appears to come slow or seems not even to exist in the business of milking cows at times. That’s due in part to the fact dairy producers deal with a large creature that craves consistency and a daily routine. They thrive on the same time for milking, feeding, and resting everyday. With a high comfort level, the animal affectionately called the “Foster Mother of the Human Race” responds with health and production. This cow care routine can lead some dairy farmers to think that doing the same thing day after day will always work.
Because of the inherent nature of dairy farms, people sometimes fail to recognize change. Henry Ford’s invention and mass production of the Model T Ford lasted 20 years. It was the ultimate innovation that freed people from relying on horse transportation. As good as Ford’s idea was, the only Model T’s to be found today are in parades or classic car shows on a Sunday afternoon. Not many people would want to use one for daily transportation. Automobile comfort and advances have come a long way in 100 years.
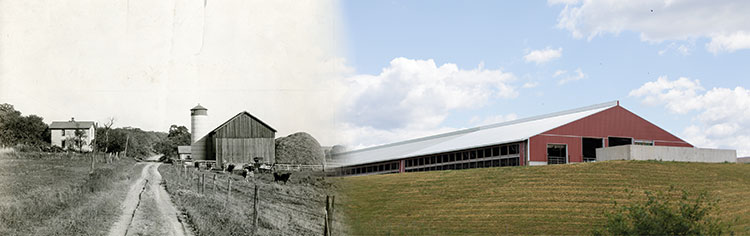
Change is all around us
A look back on the history of milking cows will help people appreciate where the business came from, where it is today, and where it will go in the future. Here are eight phases the U.S. dairy industry has gone through in the last 117 years.
As a point of information, all cow numbers, cows per farm, production per cow, and farm numbers are rounded off and the best estimates based on available information. The data listed are for the end of each phase.
Phase 1. 1900 to 1950: America had 25 million milking cows with an average of 10 cows per farm. That means 2.5 million farms with dairy cows produced about 6,000 pounds of milk per cow per year.
Most farms had a few cows solely for the purpose of providing milk for their own family. Most cows were milked by hand. During this era, the U.S. also fed much of the world while World War I and World War II raged. That’s because cows do not perform well when they share the pasture with armored tanks. By 1950, a cheese factory could be found in almost every township in the Midwest. This phase was the longest because technology, electricity, and transportation were slowly moving into rural areas.
Phase 2. 1950 to 1973: The U.S. had 10.6 million milk cows with an average of 26 cows per farm. There were 403,000 farms with cows that averaged 10,000 pounds of milk per cow.
Technologies such as refrigeration, artificial insemination, and milking machines became commonplace. The extension service, feed companies, and feed nutritionists trained many new dairy farmers on modern techniques of raising crops, housing, and husbandry. Dairy publications added to the education. West and East Coast dairy producers started adopting open housing and moving away from tie stalls. Some producers added the first generation of milking parlors.
Phase 3. 1973 to 1983: Dairy cow numbers held relatively steady at 10.8 million milk cows with an average of 39 cows per farm. During this era, 277,000 farms had a license to produce milk and cows averaged 14,000 pounds of milk.
The government milk support program would be gone by the end of this period. Cost of production was $6 per hundredweight with a milk price of $13.50. Economic inflation was running as high as 17 percent. Farm interest rates would climb to 18 percent adding to the farm crisis. The Soviet Union had a grain disaster, and many heartland region farms let the cows go for a crop rotation of corn and soybeans.
Phase 4. 1983 to 1990: Cow numbers shrank slightly to 9.5 million with an average of 61 cows per farm. There were 155,000 dairy farms in the U.S. that produced 16,000 pounds of milk per cow.
The awareness of forage quality would improve dramatically helped out by the blue Harvestore sales staff and nutritionists encouraging preflower haylage harvest. Harvesting equipment was improving. Milking parlor technology was advancing. Cow comfort in freestalls was evolving. Western herds were undergoing a massive expansion. California became the nation’s largest milk producer. Organic Valley Milk Cooperative was born in 1988, establishing a new trend.
Phase 5. 1990 to 2009: The dairy herd shrunk even further to 9.1 million milk cows with 100 cows per farm. The remaining 91,000 dairy farms had cows that averaged 18,000 pounds of milk.
This was the age of explosion seeing Midwest expansions as producers adopted the Western dairy farming model with freestall housing and updated barn design. Led by support from state government feasibility dollars, newly formed dairy organizations, financial consultants, and ag lenders, dairy farmers became willing to invest in new technology.
The period would end with the lowest milk prices in years somewhat brought on by the “Great Recession of 2008.” Producers saw losses of $5 per hundredweight of milk. Equity on the balance sheets was melting by the end of this period.
Phase 6. 2009 to 2014: Cow numbers leveled out and even climbed slightly to 9.3 million milk cows with 221 cows per farm. Dairy farm numbers dropped to an all-time low with 42,000 dairy farms and 20,000 pounds of milk being produced per cow.
Some dairy farms took five years to recover from the milk price drop in 2009. Yet, in 2014, the world did not think there was going to be enough milk and a record milk price was seen in everyone’s mailbox for the entire year. Tunnel and cross-vent freestalls were popping up like mushrooms on a damp forest floor.
Phase 7. 2014 to 2017: Cow numbers rose to 9.4 million milk cows with 232 cows per farm. There were 40,450 farms with an average production per cow of 22,000 pounds of milk.
Technology was moving more quickly. Robotic milking advances were coming from Europe and Canada. Issues surrounding farm labor now became a daily concern.
After the 2014 milk price highs, the milk price started shrinking into 2016. The European Union dropped the milk quota in 2015, which led to a pent-up desire by some of Europe to add cows. Russia refused to buy any Western dairy products after being sanctioned by the West for activities in Ukraine.
Phase 8. 2017 and beyond: The days of only taking care of cows and growing crops have now added additional responsibilities. More cows per farm require more nonfamily help. Farm family transfers to the next generation require financial consultants, accountants, and attorneys. Dairy producers have become “Human Resource” centers. Understanding the importance of balance sheets, income statements, projected cash flows, milk marketing options, and terms like liquidity are important for farm financial health.
The future
It is interesting to look at the past and intriguing to plan for the future. The business of milking cows is not driving a Model T Ford. It is important to learn from historical phases and begin a new one. No doubt, a new phase is around the corner.


