The author is a Professional Animal Scientist (PAS) based in Butler, Pa.
The real estate industry has a well known and accepted saying: Location, location, location. It means the value of a property depends on where it is located, and the price of comparable properties in size and structure can vary dramatically depending on their location.
The Federal Milk Marketing Order (FMMO) pricing system uses a similar strategy by pricing milk components based on the price of some end products produced from milk. In the FMMO system, the end products of cheese, butter, nonfat dry milk (NFDM), and whey are effectively the “location” that is used to determine the value of the components to pay dairy farmers. However, some people are concerned that these formulas fail to properly value the product that is consumed as a beverage or fluid milk. The current Class I formulas assume that the value of the components in the skim milk and the butterfat is the same as the manufactured products.
A changed game
From January 2000 until April 2019, the Advance Class I Formula price was based on the higher of the Class III or Class IV values for a two-week average of the end products’ prices. The FMMO testimony leading up to the current formulas in January 2000 emphasized many times the importance of valuing Class I above Class III or Class IV to preserve the flow of milk to the fluid markets and encourage the Class III and Class IV plants to participate in the pool.
Since May 2019, the formula for Class I has used the average of the advance Class III and Class IV values plus 74 cents. The reason given for making this change was to allow market participants of Class I milk to be able to forward contract milk by using the Class III and Class IV futures market.
In the three years since this change was made, very little, if any, milk has been forward contracted using the Class III and Class IV futures. While no one foresaw the market disruptions that would happen in 2020 with the pandemic, it proves that the higher of formula was the better formula for encouraging the pooling of milk and to better negate the massive negative producer price differentials (PPDs) that followed in 2020 and 2021.
A growing problem
Recently, there has been a lot of press pointing out that the fluid market is a shrinking market. While those analysts are correct when you look at the entire U.S., it ignores the fact that more and more milk production is concentrated in what has been called “milk islands.”
Overall, large sections of the country are deficient in Class I and Class II milk produced near where it will be consumed. Hoard’s Dairyman publishes a U.S. map in the March issue each year showing the states in red that don’t produce enough milk for even fluid or soft products.
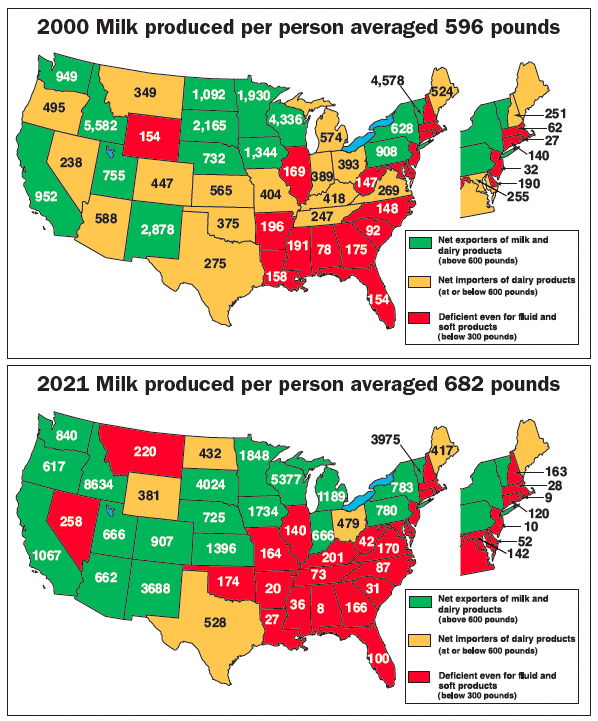
When the current FMMO formulas were enacted in 2000, 10 states from the area south of Pennsylvania and the Ohio River Valley extending to the Gulf of Mexico fell into this “red” category. Four more states were yellow, which meant they produced enough for Class I and Class II needs but were still net importers of milk products for their population. The average for these 14 states in 2000 was about 195 pounds of milk produced for each person living there.
By 2010, 18 continuous states in this region fell into the red category, and the average milk production for each person was less than 130 pounds. Fast-forward to the most recent data, and these same 18 states averaged only 90 pounds of milk per person. Unless changes are enacted, it’s easy to see the trend will continue downward in the next five to 10 years.
Pay farmers, not truckers
The current FMMO has location differentials that vary from $1.60 to $6.00 per cwt., depending on the location of the original milk plant for Class I milk. While this system helps move milk from excess areas to deficient areas to be processed, this system also discourages processors from offering over order premiums to the dairyman with closer proximity to the deficient plant. With truckers in short supply and the cost of trucking high, the pricing system needs to be able to more properly value milk where it will be marketed and be consumed to pay the dairyman proportionately instead of paying a trucker to haul the milk long distances.
Add a flat rate
Sustainability can be defined in many ways. Milk quality is extremely important for fluid milk and is not improved by hauling long distance. I would like to suggest eliminating the Class I differentials and adding a minimum of $6 per cwt. as a fluid or beverage value for all Class I milk in all federal orders.
By eliminating the differentials, the true cost of moving milk to deficient areas at current trucking costs will provide the proper incentives for the deficient plants to offer over order premiums to the farmers nearer to the plant and their consumers. The current formulas only price in the value of the components and put no value on the fluid milk itself for the beverage market. The price paid for skim milk without the butterfat is well below the cost of anyone to produce and is often retailed, especially in convenience stores, at the same price as 1%, 2%, and whole milk.
A look at markets
According to the USDA Agricultural Marketing Service (AMS) monthly survey of the largest food chains in 30 U.S. cities, only eight of them retailed 2% gallons for less than whole milk gallons. Two of the eight cities were in Pennsylvania, which has a milk marketing board setting a minimum price for each level of fat.
For the first three months of 2022, the Pennsylvania cities of Pittsburgh and Philadelphia had the highest retail price of the 30 cities and averaged over $1 more than in Miami and more than $1.50 higher than in Atlanta. These are two cities that have much higher Class I location differentials.
The Pennsylvania example is proof that beverage milk is very undervalued. The price farmers are paid for 2% milk, which is about the average level of butterfat for milk as retailed, is priced less than the other classes of milk based on the higher butterfat content of the other classes of milk as consumed.
Without putting a value on the fluid for milk consumed as a beverage in all the federal orders, the current Class I formulas will continue to undervalue it at retail and underprice it at the farm with just the current location differentials. By putting a minimum value of $6 per cwt., it would help value fluid milk properly as compared to the other uses of milk.
Digging a bit deeper
The price of Class I milk is also undervalued by the advance formulas for Class III and Class IV because of the make allowances. When these formulas are used for pricing Class I, the cost of production or make allowances for Class III and Class IV are not incurred and should be removed.
The make allowance for Class III reduces the Class I skim price by $2.53 and the Class I mover at 3.5% by $3.17. The make allowance for Class IV reduces the Class I skim price by $1.50 and the Class I mover at 3.5% by $2.17.
Since May 2019, when the Class I formula changed to the average plus 74 cents, the combined make allowance has reduced the Class I mover at 3.5% by $2.67 per cwt. for the milk that is pooled in each federal order. From January 2000 to April 2019, the Class III advance price was the higher of for 138 months and the Class IV advance price was the higher of for 94 months. The Class I mover was reduced by an average of $2.76 over the period.
Big picture impact
Since the percentage of milk pooled as Class I is different each month in each federal order, the amount of dollars that this correction would have on the blended price will vary. The effect on the price paid in those red milk-deficient states is significant, though, and likely has been a factor in the dramatic loss of dairy farms.