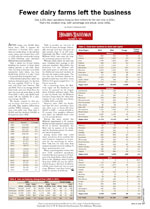
 After losing over 80,028 dairy farms since 1992, it appears the reductions in licensed dairy operations are moderating. In the last four years, losses have ranged from 1,651 to 2,195 with the watermark coming in 2009 following some extremely difficult financial conditions.
 Since 1992, the drop in licensed, or so-called commercial dairy farms, has been 80,028 from 131,509 to 51,481. That's a 61 percent drop during that time. Of the 80,028 dairies that exited the business during the past two decades, the vast majority, 57,497 or 72 percent, sold their cows between 1992 and 2002. That is an average of 5,861 dairy herds each year. Since then, the total has been cut more than in half. From 2003 to 2011, only 22,531 businesses left our industry for a nine-year average of 2,503.
The farms counted in this survey are those that have a permit to sell milk. This number differs from another USDA estimate . . . operations with milk cows. That total is 60,000 and has declined 108,500 or 64.4 percent since 1992.
When looking back at the last 20 years, average herd size has gone up 142 percent, from 74 to 179 cows nationally. Regionally, the West (+248) and the Midwest (+121) have seen the largest percentage gains in herd size.
Western herds added 32 cows last year, bringing their average to 916 cows per operation. Meanwhile, the Southeast (+6) and Midwest (+5) had small gains in herd size, while the Northeast remained constant at 95 cows for back-to-back years. The last time the Northeast showed no growth in herd size was 2004. From 2004 to 2010, gains ranged from 1 to 3 head annually.
Among states with over 1,000 dairy operations, farm numbers fell only 3 percent compared to 3.6 percent for the remaining 39 states. New York was the only state that bucked national trends by adding 70 dairy operations last year.
When evaluating other states with over 1,000 permitted operations, Iowa lost the most ground as 6.7 percent of its dairy farms called it quits. That is the Hawkeye state's largest drop since 2003 and may be attributed to farmers who have decided to sell the dairy herd and turn to cash crops. Missouri was close behind as it lost 6.1 percent of its farms.
For a complete look at the statistics, click here to download the article, which will appear in the March 10 issue.


