The author is director of Dairy Policy Analysis, University of Wisconsin-Madison.
Periodically it's interesting to look a little deeper at big trends in the dairy industry: milk per cow, per capita fluid consumption, Greek yogurt and so forth. We haven't looked closely at geographic changes in milk production for a while, and that's our charge for today.
Most of us could cite some of the bigger trends in milk production like the West has been growing while the Southeast has contracted. Most of us would even know that individual states within those regions, like California and Idaho, have been growing at a steady pace. But sometimes even state geographies are too large and mask a lot of the interesting detail in production trends.
Not perfect information
A few states report county-level milk production, but most do not. Many federal or state marketing orders also list producer receipts at the level of counties. Recently, the Agricultural Census was mailed out to producers, but even this detailed questionnaire doesn't ask about milk production. It does, however, report the number of dairy cows in most counties and is another means of estimating county milk production where those records don't otherwise exist.
I have recorded or estimated county milk production for the 48 contiguous states in 2001 and 2011. This lets us look at a much more granular detail regarding milk production trends over the last decade. Using mapping software, the county data is displayed in the map with shades of green showing growth and shades of red showing decline. A buff color indicates no strong change in milk production.
The mapping software interpolates between data points to "fill in the gaps." In most places this is a reasonable thing to do, but in a few regions like the northeast corner of Nevada, there really aren't many cows even though the corner is green (this is because the mapping software is grabbing surges in milk production in Oregon, Idaho and Utah around that area of Nevada).
A tale of two destinies
With the additional detail, some finer observations are possible. California is a good case in point. While the state has had dramatic growth in total milk production, the bulk of that growth has occurred in the Central Valley. Ironically, the largest reductions in milk production in the country have occurred in California's southern region.
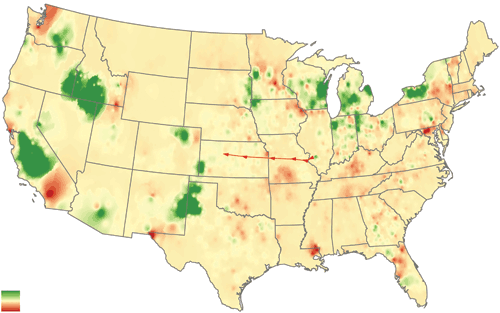
Chart: Green= Largest increase = 2,596,898 kg/km2
Rust= Largest decline = 295,363 kg/km2
Milk has moved away from cities between 2001 and 2011. Red areas indicate less milk in 2011 than 2001, green areas mean more and a buff color designates a neutral milk region.
Almost every region where you see a dark red area indicating a sharp decline in production has a large and growing population center nearby. For example, Seattle, El Paso, New Orleans, Baltimore-Washington and Minneapolis. It is also worth noting that the vast majority of the country has a pink hue, indicating a more general loss of milk production.
The milk production growth that has occurred over the recent decade has been in a dozen relatively concentrated areas. In the Great Lakes region, Western New York has certainly grown. Michigan has a couple of distinct regions in the Thumb and central portion of the state. Wisconsin shows more milk in the bottom two-thirds of the state with the heaviest gains in the eastern portion.
Ohio and Indiana both have growth pockets in the northwest corners of each state. And Minnesota and South Dakota have a shared growth region along the I-29 highway corridor. More toward the west, eastern New Mexico and the Texas Panhandle have had significant growth as well as a couple of concentrations north of there in Kansas and Colorado. Arizona has a growth area as does Oregon and Washington state in the high desert regions. And, of course, Idaho really stands out.
This change in the milk density map also has a series of arrows in the center of the country. The points labeled 1960 through 2010 are the centroids - or the geographically weighted average - of milk production over the last five decades.
Clearly, the general movement of milk has been to the west and somewhat to the north over this time period. If you look at the last decade in finer increments of individual years, you would see that the westward movement has not stopped, but it is slowing down. And, in a year like 2009 (and probably 2012) when the contraction in U.S. milk production was almost entirely in the western states, the centroid actually retreated temporarily to the east.
Where are the cows?
The green and red map shows changes in milk density, but it doesn't show you where the cows actually are. It is entirely possible that some locations haven't changed much, but there is still a significant dairy industry there. The second map is a dot-density map where each dot represents the approximate location of 1,500 cows in 2011. For the most part, areas showing either strong growth or decline are areas that still have many cows.
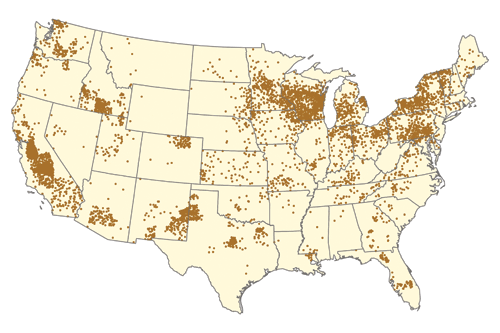
Each dot on this map represents 1,500 cows. Generally speaking, the country's growth pockets are taking cows from somewhere else; not many areas are the same as they were in cow numbers 10 or 20 years ago.
The U.S. continues to produce milk in all states - even Alaska and Hawaii. But the trends seem to show that dairy is concentrating into ever more dense pockets of production. The Southeastern quadrant of the country is about 40 billion pounds of milk net deficit annually and growing more so every year. Some of this is attributable to population pressures, but much can be blamed on genetic and management advances in milk yields that are hard to be realized in hot and humid climates. And, when milk supplies dwindle below a critical threshold, the loss of dairy infrastructure just makes milk production even more expensive.
Growth pockets seem to occur with two different flavors: One where dairy is already dense in traditional regions (think of Wisconsin and New York) and existing farms expand at a slower and steady pace; and more explosive growth where farms are co-locating with dairy plants (we've seen this in Oregon, California, Texas and more recently Colorado).
Our dairy industry continues to evolve as we explore the economic benefits of expanding milk production in some regions of the country while contracting in others. The next decade will likely show us some new trends.
This article appears on page 191 of March 25, 2013 issue of Hoard's Dairyman.
Periodically it's interesting to look a little deeper at big trends in the dairy industry: milk per cow, per capita fluid consumption, Greek yogurt and so forth. We haven't looked closely at geographic changes in milk production for a while, and that's our charge for today.
Most of us could cite some of the bigger trends in milk production like the West has been growing while the Southeast has contracted. Most of us would even know that individual states within those regions, like California and Idaho, have been growing at a steady pace. But sometimes even state geographies are too large and mask a lot of the interesting detail in production trends.
Not perfect information
A few states report county-level milk production, but most do not. Many federal or state marketing orders also list producer receipts at the level of counties. Recently, the Agricultural Census was mailed out to producers, but even this detailed questionnaire doesn't ask about milk production. It does, however, report the number of dairy cows in most counties and is another means of estimating county milk production where those records don't otherwise exist.
I have recorded or estimated county milk production for the 48 contiguous states in 2001 and 2011. This lets us look at a much more granular detail regarding milk production trends over the last decade. Using mapping software, the county data is displayed in the map with shades of green showing growth and shades of red showing decline. A buff color indicates no strong change in milk production.
The mapping software interpolates between data points to "fill in the gaps." In most places this is a reasonable thing to do, but in a few regions like the northeast corner of Nevada, there really aren't many cows even though the corner is green (this is because the mapping software is grabbing surges in milk production in Oregon, Idaho and Utah around that area of Nevada).
A tale of two destinies
With the additional detail, some finer observations are possible. California is a good case in point. While the state has had dramatic growth in total milk production, the bulk of that growth has occurred in the Central Valley. Ironically, the largest reductions in milk production in the country have occurred in California's southern region.
Chart: Green= Largest increase = 2,596,898 kg/km2
Rust= Largest decline = 295,363 kg/km2
Milk has moved away from cities between 2001 and 2011. Red areas indicate less milk in 2011 than 2001, green areas mean more and a buff color designates a neutral milk region.
Almost every region where you see a dark red area indicating a sharp decline in production has a large and growing population center nearby. For example, Seattle, El Paso, New Orleans, Baltimore-Washington and Minneapolis. It is also worth noting that the vast majority of the country has a pink hue, indicating a more general loss of milk production.
The milk production growth that has occurred over the recent decade has been in a dozen relatively concentrated areas. In the Great Lakes region, Western New York has certainly grown. Michigan has a couple of distinct regions in the Thumb and central portion of the state. Wisconsin shows more milk in the bottom two-thirds of the state with the heaviest gains in the eastern portion.
Ohio and Indiana both have growth pockets in the northwest corners of each state. And Minnesota and South Dakota have a shared growth region along the I-29 highway corridor. More toward the west, eastern New Mexico and the Texas Panhandle have had significant growth as well as a couple of concentrations north of there in Kansas and Colorado. Arizona has a growth area as does Oregon and Washington state in the high desert regions. And, of course, Idaho really stands out.
This change in the milk density map also has a series of arrows in the center of the country. The points labeled 1960 through 2010 are the centroids - or the geographically weighted average - of milk production over the last five decades.
Clearly, the general movement of milk has been to the west and somewhat to the north over this time period. If you look at the last decade in finer increments of individual years, you would see that the westward movement has not stopped, but it is slowing down. And, in a year like 2009 (and probably 2012) when the contraction in U.S. milk production was almost entirely in the western states, the centroid actually retreated temporarily to the east.
Where are the cows?
The green and red map shows changes in milk density, but it doesn't show you where the cows actually are. It is entirely possible that some locations haven't changed much, but there is still a significant dairy industry there. The second map is a dot-density map where each dot represents the approximate location of 1,500 cows in 2011. For the most part, areas showing either strong growth or decline are areas that still have many cows.
Each dot on this map represents 1,500 cows. Generally speaking, the country's growth pockets are taking cows from somewhere else; not many areas are the same as they were in cow numbers 10 or 20 years ago.
The U.S. continues to produce milk in all states - even Alaska and Hawaii. But the trends seem to show that dairy is concentrating into ever more dense pockets of production. The Southeastern quadrant of the country is about 40 billion pounds of milk net deficit annually and growing more so every year. Some of this is attributable to population pressures, but much can be blamed on genetic and management advances in milk yields that are hard to be realized in hot and humid climates. And, when milk supplies dwindle below a critical threshold, the loss of dairy infrastructure just makes milk production even more expensive.
Growth pockets seem to occur with two different flavors: One where dairy is already dense in traditional regions (think of Wisconsin and New York) and existing farms expand at a slower and steady pace; and more explosive growth where farms are co-locating with dairy plants (we've seen this in Oregon, California, Texas and more recently Colorado).
Our dairy industry continues to evolve as we explore the economic benefits of expanding milk production in some regions of the country while contracting in others. The next decade will likely show us some new trends.
This article appears on page 191 of March 25, 2013 issue of Hoard's Dairyman.