Consider this: We still have COVID-19 toying with us. Are we in a recession or not? Inflation is huge. But what are the impacts? Are climate changes (like extreme drought) short-term or the new normal?
If I avoid talking about the level of milk prices, let me at least discuss changes in the “tilt” of milk prices. By tilt, I mean what in other commodities might be called the basis, or regional differences in price. These are an economic consequence of local supply and demand for a product and the cost of sourcing it more remotely.
Dairy’s basis
In Federal Milk Marketing Orders, we make an attempt to acknowledge these differences through Class I differentials across the country and the zoning of milk prices within an order, which distributes the PPD generated from the local pool. The Class I differentials are set in stone . . . until they aren’t.
The supply and demand for milk and dairy products changes over time, and occasionally, federal orders need to re-examine the differentials to see if they are properly set. Class I differentials are really like the guardrails that try to keep milk movement out of the ditch. The markets are free to wander between the guardrails and move milk with premiums above the Class I minimums. But if the minimums are too far from the edge of market forces — either too low or too high — there’s still room for problems.
We continue to produce milk in all 50 states. However, there is so little milk in a few states, like Alaska and Hawaii, that the National Agricultural Statistics Service (NASS) has stopped reporting statistics in those two markets. We can look at the rest of the lower 48 states and see what has been changing. A few states report county level milk production. For those states that do not, I have estimated milk production by county. This is done using Ag Census dairy cow numbers to allocate the production within the state. It isn’t perfect, but it provides a degree of insight.
The local demand
We also don’t collect consumption data on milk and dairy products. However, the Economic Research Service (ERS) makes a fat-equivalent estimate of the milk consumption per capita annually. I used this data and the population by county to estimate local demand for milk needed to produce the dairy products.
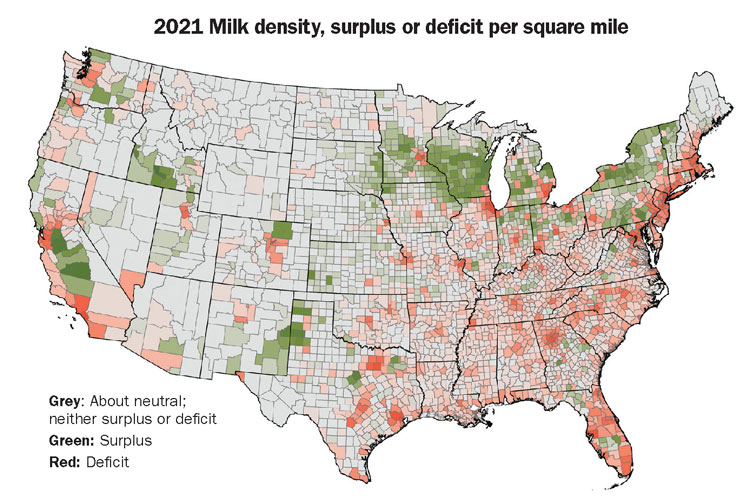
The milk production minus the milk demand estimates yields a calculation of “milk surplus” or “milk deficit” by county. I’ve also normalized that data by the square miles in the county geography to get a density. That way, the degree of surplus or deficit are comparable even though the geographic size of the county will differ. These results are shown in the map.
Gray colored counties may be slightly surplus or deficit, but they are pretty close to neutral. Green colored shades indicate the degree of surplus in a county and red shows deficit.
It’s pretty easy to pick out the large cities, where we have stronger red colors. Most dairy producers also will recognize pockets of surplus where it is possible that cows outnumber people, or at least their milk production well surpasses the local population’s demand for milk.
The big picture
There are some broad regional patterns to this surplus and deficit. First of all, the Southeast is generally deficit. For instance, Florida is our most deficit state by a considerable margin, followed by Illinois and North Carolina. Wisconsin is the most surplus state, followed by California and Idaho.
If the dairy industry is going to meet consumer demand, dairy products, or at least inputs, have to move some distance to get to folks. As such, transportation costs are going to play a role, too.
The industry has configured itself in such a way that fluid milk plants tend to be located closest to points of consumption — large cities. It’s expensive to ship water long distances. More nutrient-dense dairy products tend to be made in the surplus regions where we can extract the water at nearby plants and ship the more concentrated products, like cheese or butter, a longer distance.
One can also look at this on a regional basis. You can see an illustration below, essentially, I have aggregated the surplus and deficit by states within regions, and a few trends started to appear.
The Northeastern region is somewhat deficit, but it has been growing milk supplies just enough to keep up with slowed population growth.
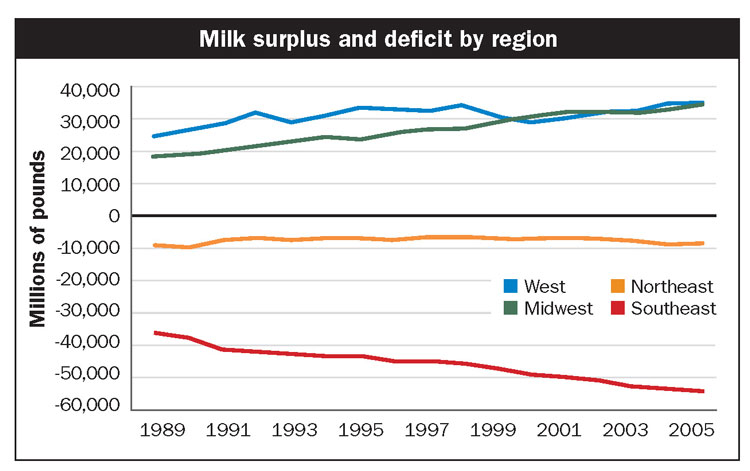
The Western portion of the country has grown somewhat more surplus over time, but that trend has been disrupted in some years. The Midwestern region has been steadily growing surplus as they’ve gained cows at a more rapid pace than people. And the Southeastern region is a huge deficit area and steadily growing more so all the time. That means more dairy products are moving longer distances than ever before.
There were changes made to Class I differentials in a portion of the Southeast in 2008, but most of the country has had the same differentials since the federal order reform in the year 2000. Supply has changed, demand has changed, and the costs of transportation have changed in the intervening 20 years. It’s pretty hard to imagine that differentials won’t be part of a needed discussion for federal order changes in the near future.