The author is an associate professor of dairy cattle genetics at Penn State University.
The next round of genetic evaluations is scheduled to be released December 2. These evaluations will involve a great deal more than just typical proofs, as there will be a base change and updates to $CM (Cheese Merit $), $NM (Net Merit $) and $FM (Fluid Merit $) formulas.
Typically, our genetic evaluations undergo a base change every five years to accommodate the upward trend that we see for genetic improvement for most traits. The last genetic base change occurred in January of 2010. We moved January genetic evaluations forward one month at the end of 2010 to provide more even spacing between our tri-annual evaluations (April, August, December), which is why the base change is in December rather than January this time.
A contrast between the dairy and beef industries helps to explain why we choose to update our genetic base at a set interval. The genetic base for Angus is not updated, and their traits are relative to animals born in 1979. The advantage of such an approach is that genetic evaluations do not undergo a large downward adjustment every five years. However, today's typical Holstein sire would have a milk yield PTA (predicted transmitting ability) of +6,500 pounds if we chose to follow that beef industry model.
Beginning in December, all PTA will be compared to the average genetic merit of cows born in 2010. This "point in time" represents our current mature cow population. Waiting five years between base changes is a balancing act that results in PTAs that are relatively stable for a reasonable period of time while allowing the PTA values to be relevant to the current cow population.
A net gain overall
Scientists at USDA and CDCB (Council on Dairy Cattle Breeding) have published the amount of progress in PTA that has been achieved for all breeds. I've highlighted progress for selected traits in Table 1.
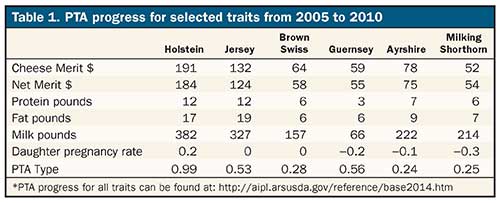
Milk, fat and protein yield rose for all breeds from 2005 to 2010. This, along with progress for other traits, helped to drive gains in $CM, $NM and $FM. PTA for type also rose for all of our breeds, and DPR (daughter pregnancy rate) improved by a marginal extent for Holsteins.
There are some traits not presented in the table that one can argue have moved in the wrong direction. If you think today's cows are larger and more frail, your eyes are not deceiving you, and we will address some of those trends in a future column.
The values presented here will be subtracted from the PTA of bulls and cows beginning in December. For example, a Holstein bull that is currently +2,000 pounds of milk and +2.0 for type is expected to be +1,618 for milk and +1.01 for type.
It should be noted that these changes will impact all bulls and cows equally. Every Holstein bull, for example, will have 382 pounds deducted from his PTA milk. This means that there will not be re-ranking because of the base change. Bulls will add new daughters to their proof causing additional shifts in PTA depending on how their daughters perform, but that is not the result of the base change.
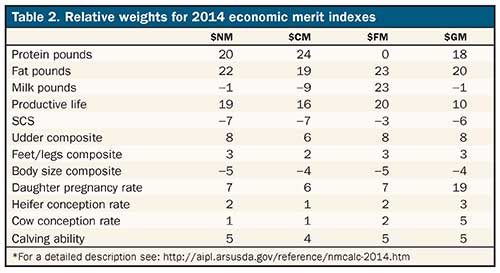
Updates to the formulas for $CM, $NM and $FM will also be implemented in December. The relative weight that will be put on each trait is reported in Table 2 along with weights for the new $GM (Grazing Merit $) formula. For some traits (SCS, body size composite) we want to see a reduction rather than a gain, and those traits have a negative sign before their relative weight.
Shifts in the formula
There are some subtle changes when compared to the 2010 $NM version. The 2014 numbers represent a 3 percent shift in emphasis away from both productive life and SCS. This emphasis will be shifted toward yield, which will have 43 percent of the total emphasis in $NM compared with 35 percent previously.
We have also introduced two new fertility traits to the index which are HCR (heifer conception rate) and CCR (cow conception rate). Together with DPR, we will be placing 10 percent of the $NM emphasis on fertility, which is similar to the 11 percent placed on DPR in the 2010 version.
Calving ability is only available for Holsteins and Brown Swiss. This means that the relative weight toward other traits is slightly higher for the other breeds, with protein yield weighted by 21 percent in $NM, for instance.
The weights presented for these formulas are determined on the basis of economic conditions such as milk, feed and beef prices over the past few years. Higher milk prices (more recently) are largely responsible for the greater emphasis on yield traits. In addition to the economic value for each trait, the degree of genetic differences among bulls and cows has an influence on the relative weights. Protein is generally more valuable than fat in most markets. However, fat varies more among cows than protein, and we end up placing slightly more emphasis on fat because of this.
There are other changes that will be made to our genetic evaluation system, including updates to the breed association selection indexes. I will focus on changes to the other indexes and discuss $GM more in December. There has also been statistical and software upgrades to our genetic evaluation system, and those that participate in genomic testing have begun to receive preliminary genomic evaluations on a weekly basis.
In short, be prepared to see bull proofs drop in December, and keep in mind that this was expected and actually a good thing. If we did not see change when it came time to update our base, it would mean that we did not make genetic progress. These numbers demonstrate that dairy cattle breeders did a good job selecting cows that are more economically efficient, productive and healthy.
This article appears on page 691 of the October 25, 2014 issue of Hoard's Dairyman.
The next round of genetic evaluations is scheduled to be released December 2. These evaluations will involve a great deal more than just typical proofs, as there will be a base change and updates to $CM (Cheese Merit $), $NM (Net Merit $) and $FM (Fluid Merit $) formulas.
Typically, our genetic evaluations undergo a base change every five years to accommodate the upward trend that we see for genetic improvement for most traits. The last genetic base change occurred in January of 2010. We moved January genetic evaluations forward one month at the end of 2010 to provide more even spacing between our tri-annual evaluations (April, August, December), which is why the base change is in December rather than January this time.
A contrast between the dairy and beef industries helps to explain why we choose to update our genetic base at a set interval. The genetic base for Angus is not updated, and their traits are relative to animals born in 1979. The advantage of such an approach is that genetic evaluations do not undergo a large downward adjustment every five years. However, today's typical Holstein sire would have a milk yield PTA (predicted transmitting ability) of +6,500 pounds if we chose to follow that beef industry model.
Beginning in December, all PTA will be compared to the average genetic merit of cows born in 2010. This "point in time" represents our current mature cow population. Waiting five years between base changes is a balancing act that results in PTAs that are relatively stable for a reasonable period of time while allowing the PTA values to be relevant to the current cow population.
A net gain overall
Scientists at USDA and CDCB (Council on Dairy Cattle Breeding) have published the amount of progress in PTA that has been achieved for all breeds. I've highlighted progress for selected traits in Table 1.
Milk, fat and protein yield rose for all breeds from 2005 to 2010. This, along with progress for other traits, helped to drive gains in $CM, $NM and $FM. PTA for type also rose for all of our breeds, and DPR (daughter pregnancy rate) improved by a marginal extent for Holsteins.
There are some traits not presented in the table that one can argue have moved in the wrong direction. If you think today's cows are larger and more frail, your eyes are not deceiving you, and we will address some of those trends in a future column.
The values presented here will be subtracted from the PTA of bulls and cows beginning in December. For example, a Holstein bull that is currently +2,000 pounds of milk and +2.0 for type is expected to be +1,618 for milk and +1.01 for type.
It should be noted that these changes will impact all bulls and cows equally. Every Holstein bull, for example, will have 382 pounds deducted from his PTA milk. This means that there will not be re-ranking because of the base change. Bulls will add new daughters to their proof causing additional shifts in PTA depending on how their daughters perform, but that is not the result of the base change.
Updates to the formulas for $CM, $NM and $FM will also be implemented in December. The relative weight that will be put on each trait is reported in Table 2 along with weights for the new $GM (Grazing Merit $) formula. For some traits (SCS, body size composite) we want to see a reduction rather than a gain, and those traits have a negative sign before their relative weight.
Shifts in the formula
There are some subtle changes when compared to the 2010 $NM version. The 2014 numbers represent a 3 percent shift in emphasis away from both productive life and SCS. This emphasis will be shifted toward yield, which will have 43 percent of the total emphasis in $NM compared with 35 percent previously.
We have also introduced two new fertility traits to the index which are HCR (heifer conception rate) and CCR (cow conception rate). Together with DPR, we will be placing 10 percent of the $NM emphasis on fertility, which is similar to the 11 percent placed on DPR in the 2010 version.
Calving ability is only available for Holsteins and Brown Swiss. This means that the relative weight toward other traits is slightly higher for the other breeds, with protein yield weighted by 21 percent in $NM, for instance.
The weights presented for these formulas are determined on the basis of economic conditions such as milk, feed and beef prices over the past few years. Higher milk prices (more recently) are largely responsible for the greater emphasis on yield traits. In addition to the economic value for each trait, the degree of genetic differences among bulls and cows has an influence on the relative weights. Protein is generally more valuable than fat in most markets. However, fat varies more among cows than protein, and we end up placing slightly more emphasis on fat because of this.
There are other changes that will be made to our genetic evaluation system, including updates to the breed association selection indexes. I will focus on changes to the other indexes and discuss $GM more in December. There has also been statistical and software upgrades to our genetic evaluation system, and those that participate in genomic testing have begun to receive preliminary genomic evaluations on a weekly basis.
In short, be prepared to see bull proofs drop in December, and keep in mind that this was expected and actually a good thing. If we did not see change when it came time to update our base, it would mean that we did not make genetic progress. These numbers demonstrate that dairy cattle breeders did a good job selecting cows that are more economically efficient, productive and healthy.