Dating back as far as the 1950s, nutrition research and advice pointed to fat, particularly saturated fat, as the culprit behind the country’s growing problem with heart disease and obesity. The scientific evidence was weak, and it had already pointed to refined carbohydrates as a possibly more likely cause, but the anti-fat hypothesis argument won out. At that point, the “anti-fat” mantra became entrenched in medical advice and government nutrition guidelines for decades.
Butter, cheese, and other fat-containing dairy foods took a hit during this period . . . until worsening obesity and heart disease finally led to a reassessment. Checkoff-funded nutrition research into the true and positive role of dietary fat consumption in a healthy diet played a major role in this re-evaluation.
Changing buying patterns
While official guidelines are slowly changing in response, consumers have been much quicker to act and have been switching to higher fat foods — including dairy — seemingly across the board. This fundamentally altered the basic supply-demand situation for milkfat. Note that this unfolding is a story about milkfat, not just butter.
In fact, this newfound demand for milkfat is affecting most major categories of dairy products. For example, sales of fluid whole milk dropped by an average of 2.5 percent per year between January 2000 and June 2013. After June 2013, whole milk sales climbed by an average of 3 percent year-over-year.
Although the total fluid milk category continues to lose volume sales, the major reversal in whole milk sales has been sufficient to enhance the consumption of milkfat in the entire fluid milk category in recent months. Between January 2000 and June 2015, estimated consumption of milkfat in all fluid milk products dropped by an average of 1 percent per year, but since then it has grown by an average of 1.2 percent year-over-year.
The same milkfat consumption patterns are undoubtedly taking place in other dairy product categories, such as frozen dairy products, yogurt, and cheese. These uses account for the largest share of total milkfat production. However, publicly-available data from USDA is not sufficiently fine-tuned to make a definitive determination for products other than fluid, frozen products, and, of course, butter itself. More detailed market research data will be required for analysis of other categories.
Butter basics
When it comes to dairy product manufacturing, butter production is a residual product. Essentially, other dairy products such as whole milk, ice cream, cheese, and yogurt get produced before butter . . . then the remaining cream has a chance to get to the nation’s butter churns. But so far, total milkfat production has kept pace with demand in all those other products, permitting butter consumption to grow as well.
That market development allowed per capita butter consumption to hit a 51-year high of 5.9 pounds in 2016. In fact, the consumption of milkfat, in the form of butter, has grown from about 16 percent of total U.S. milkfat in 2000 to more than 18 percent today.
The likelihood that total milkfat consumption is outpacing growth of total milkfat production, as it clearly is for butter, is where price implications come into the picture. The idea that this price scenario is likely occurring in the U.S. domestic market is strongly supported by the fact that the U.S. dairy trade balance in milkfat (total milkfat exports minus milkfat imports, in all products) has dropped from the record-equivalent high of 5.2 percent to 0.6 percent. This situation has unfolded in a relatively short window from the July 2013 to June 2014 export high to the current low from January 2016 to now.
In other words, the U.S. dairy industry has pulled over 4.5 percent of total U.S. milkfat back out of the export market over the past few years in order to meet growing domestic demand. While the U.S. milkfat trade balance could be drawn down still further, this is increasingly unlikely.
Points to higher prices
Demand growth outpacing supply means just one thing in a commodity market: higher prices. Butter prices are where the supply-demand balance for all milkfat is reflected in the U.S. dairy industry. A quick glance at any historic chart of butter prices clearly shows an obvious strong upward trend in recent years. In fact, it appears we have reached the point where $2 butter seems to represent an effective price floor given the current butter market. Let’s take a reflective step back before further discussing butter’s new role in the All-Milk price.
Interestingly, just a few years ago, butter prices showed the lowest trend of all the four major products used in federal order pricing formulas — the others being cheese, nonfat dry milk, and dry whey — a stark reflection of the former nutritional orthodoxy on the effect of fat consumption on human health.
Let’s come back to more recent times. USDA’s Dairy Market News often contains comments such as “Demand for butterfat continues to be a primary driving force within the dairy industry” (Dairy Market News June 23, 2017) and “Some market participants consider the possibility of a $3 CME cash price by the early fall” (Dairy Market News August 4, 2017).
Contributing to this is the fact that milk production, and hence milkfat production growth, has been moderating in recent months. Recent Dairy Market News international commentaries also indicate that tight domestic markets, higher prices, and reduced exports are happening in milkfat markets in many other countries, particularly in Europe, New Zealand, and Australia.
Butter contributes 50-plus percent
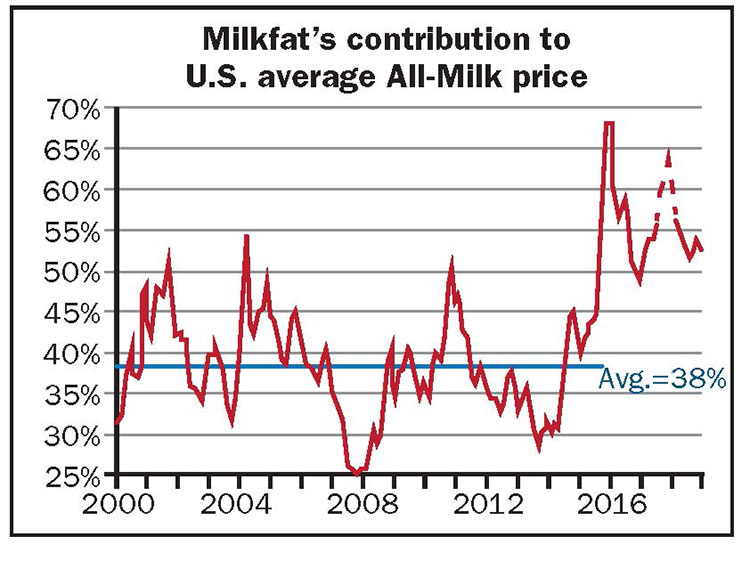
Back home in the United States, this major market development — powered by a long-overdue reassessment of decades-long misguided nutrition orthodoxy, aided by checkoff-funded research over many years — is paying huge dividends to U.S. dairy farmers. For years, leading up to mid-2015, milkfat made an estimated 38 percent average contribution to the USDA-reported price received by farmers for milk sold in the United States. (See figure.) This percentage subsequently climbed to a new level above 50 percent.
Dairy futures markets predict this market shift will continue for the foreseeable future (dotted line in the figure, based on early August CME settlements). This has helped generate billions of dollars of income for U.S. dairy farmers, both when domestic markets are weak, as in the spring of 2016, as well as when they are robust.