For those who aren’t familiar with the Federal Milk Marketing Orders, the Class III milk price is the minimum price of milk that cheese plants are supposed to pay dairy farmers. Meanwhile, the Class IV price is the minimum price that butter/nonfat dry milk plants are supposed to pay.
The designation of “Class III” or “Class IV” milk applies only to the price of the milk; there is no difference in the quality or attributes of the physical milk going into these plants.
Within the pricing structure exists a common industry perception that says Class III should be above Class IV most of the time. But is that actually the case?
As Mark Twain wrote, “Whenever you find that you are on the side of the majority, it is time to pause and reflect.”
Comparing Class III and Class IV
If one price was consistently above the other, farmers (co-ops) would direct all surplus milk to the higher return products, which would quickly bring the prices back into alignment. But those conditions don’t match the real world, and there is enough friction in the system that the prices do deviate from each other.

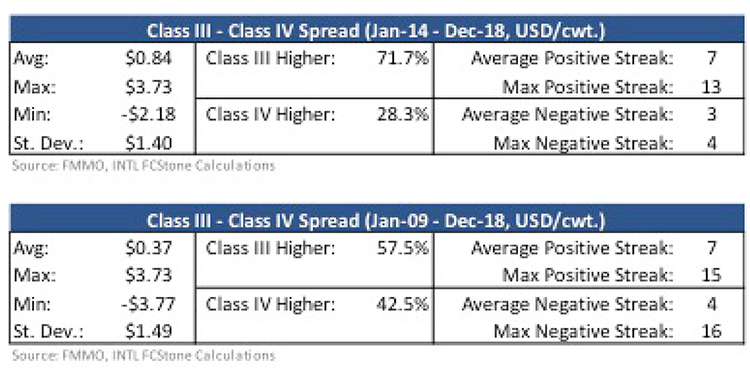
In the past 19 years, Class III has been above Class IV 59 percent of the time. The past 10 years have been similar, with Class III above 58 percent of the time. But . . . in the past five years, Class III has been higher nearly 72 percent of the time.
One explanation might be that co-ops own most of the butter and nonfat dry milk (NFDM) capacity in the country. If they can’t sell the raw milk to a commercial processor, then the co-op has to run it through their own plants. We’ve generally had a surplus of milk in recent years, which is likely leaving extra milk for the co-ops to process, and that has kept Class IV low relative to Class III.
Theoretically, we should be able to look at cheese and butter production data to determine if processors/co-ops are shifting milk from one class to the other to take advantage of the relative prices.
Do product shifts happen?
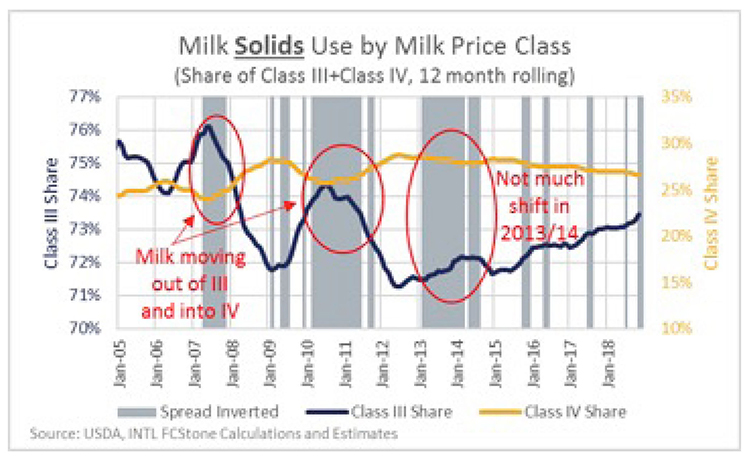
This is easier said than done because there’s a not a clear shift. After crunching the numbers again this month, the resulting graph may be the best I’ve ever been able to produce showing a shift does in fact happen . . . at least sometimes.

In the graph, if you look at 2007 and 2010 to 2011 when Class IV prices were above III (shaded grey), the share of milk solids going into Class III fell. Meanwhile, the share going to Class IV increased as you would expect, but it looks like it took at least a couple months of the inverted spread to make the shift happen.
That pattern fell apart in 2013 and 2014. Class IV went above Class III, but the share of milk solids going to Class III continued to rise.
Milk production growth was weak during 2013, so it might have been a case where cheese plants had forward sales in place or contracts to buy fixed quantities of milk. Class IV production fell because there just wasn’t much left-over milk after the cheese plants got what they needed. Ultimately, since 2014, cheese has been taking a larger share of the milk and the short periods of inverted spread haven’t been enough to really change the allocation between III and IV.
What does it mean moving forward?
The spread was inverted November through February, and it looks very likely that it will be in March as well. The end of Q1 (the first quarter) will mark five months in a row. That is just about long enough to start to cause a shift if one is going to happen. But with milk production growth running weak, it’s also possible we could get into a situation like 2013 where there isn’t enough surplus milk available to shift around.
We might not see much supply side adjustment, which would bring Class IV below Class III for at least a few more months.
And, if the futures markets are correct, an adjustment of Class III over IV might not even happen during 2019.
For more details and forecasts sign up for a free trial of our market intelligence service at http://ifcs.co/dairy.


