Some people go through life collecting all kinds of observations and opinions . . . just like keeping all those tattered receipts in your wallet instead of just keeping the receipts that are truly needed. Dairy market participants do this a lot. And, as a dairy broker, I’m just as guilty of this as the next guy. Collecting information — however mundane and unusual – to gain understanding of market direction is the name of the game.
But if you truly want a lens with which to view the market, you’re often best served to highlight the single most important factor. What is that key underlying theme for the balance of 2019?
This year, that main motivating factor — and the justification for higher board prices across the entire dairy complex — boils down to milk production. Production is down.
So far, U.S. milk production is flat versus last year through June. Dairy producers have done a great job of improving component production — particularly fat — for several years now. Component production bumps U.S. milk production to 0.8 percent growth for the first six months of this year. Still that’s down from last year.
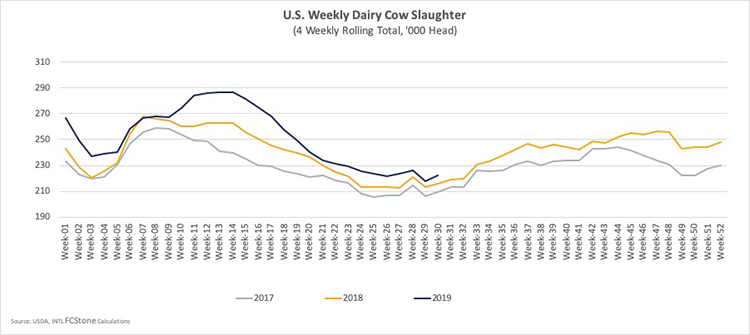
Milk production for 2018 was up 1.1 percent, and components were up 2 percent. But that was last year. Now we’re facing heavier culling and reduced output leaving traders of every stripe concerned about production falling short in the face of relatively solid dairy product demand. And the prospects of turning around milk production don’t seem to be in the cards.
Last Friday, the USDA released the July 1 Cattle report. Twice a year the USDA releases estimates of the number of all bovines in the U.S. (January 1 and July 1 estimates).
The January 1 estimate is a little more rigorous, but this July 1st estimate is the second most rigorous counting of cows that the USDA does throughout the year. With respect to dairy cows, the next most rigorous would be the quarterly estimates in the Milk Production reports followed by the monthly estimates (between quarterly reports).
The July 1 number is important, and the USDA will typically revise their quarterly and month estimates in line with it. Technically the “cow number” in the milk production report is supposed to be the average number of cows over the course of the month, while this “July 1” number is supposed to be the number of cows that were in the herd on a single day, July 1, so they don’t always line up exactly. But the July 1 estimate for 2019 is 9.3 million cows, and that is 23,000 head less than the USDA’s published for June this week.
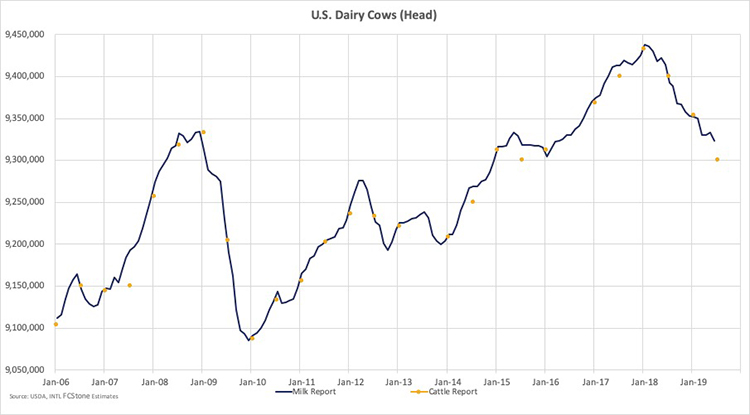
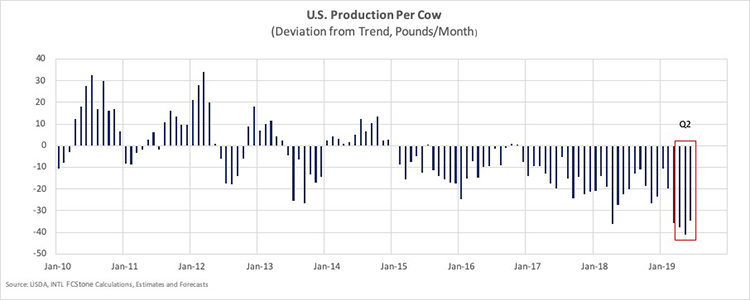
The USDA is probably going to show either a big decline in the size of the herd between June and July next month, or they are going to revise down the size of the herd for the second quarter to smooth the decline. If they leave their estimate of production unchanged then the downward revision to cow numbers will raise the estimated production per cow. Second quarter production per cow was a record amount below trend, so there is room to revise production per cow higher.
Does any of this matter?
Absolutely it does.
It takes time to build the herd up. Even if you assume good weather and better production per cow moving forward, today’s scenario keeps headline milk production growth below 1 percent through early 2020. Less milk production in the U.S. leaves the U.S. more vulnerable to a feed cost or weather shock over the next year.
So, trade wars and currency exchange rates matter.
The new desire for full fat dairy products, and those questionable plant-based alternatives matter. But for now — and for the next six to 12 months — the elephant in the room is milk production. Production or the lack thereof is underpinning the whole market, and we don’t see that changing anytime soon.