Domestic consumption struggled behind inflationary pressures. However, that demand pressure was partially offset by record volumes of U.S. dairy products moving overseas.
Those butter and nonfat dry milk powder values, in turn, caused the Class-III-to-Class IV spread to reach over $2.50 per cwt. This was the second highest spread in the past 10 years, trailing only 2020, the year impacted by COVID-19 lockdowns, the Farmers to Families Food Box Program, and widespread depooling.
A short-lived run
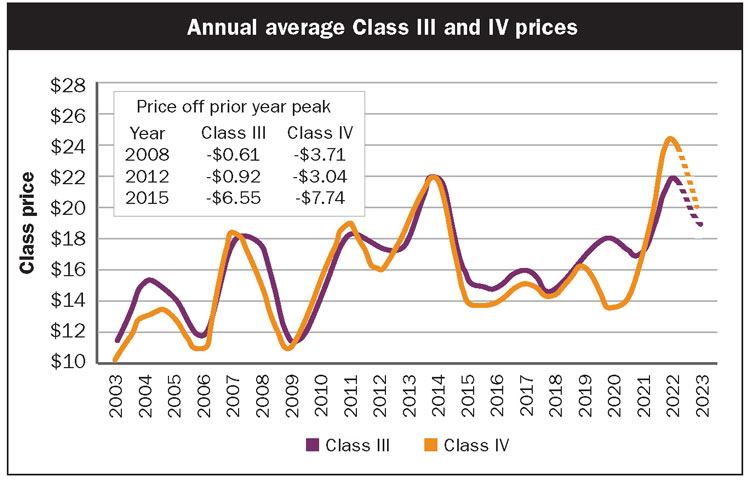
It’s no secret that price peaks rarely last very long. High prices lead to higher milk production and reduced commodity prices, but not all declines are equal. As illustrated in the figure, in the last 20 years following price peaks, Class IV prices have historically fallen twice as far as Class III prices. For example, in 2012 Class IV dropped $3 off 2011 highs. Meanwhile, Class III dipped by just under $1 per cwt. In short, the new milk production growth flowed disproportionately into Class IV product channels.
This year, markets appear to be shaping up in a way that’s distinctly different from previous cycles. Futures markets in mid-February showed a decline in Class III and IV prices for 2023. However, unlike years past, both classes are expected to remain roughly equivalent to one another. Class III is projected to be around $19 per cwt., while Class IV averages are closer to $19.50.
This developing situation bucks the historic trend of disproportionately steeper Class IV declines relative to Class III. This begs the question: Why are futures not following historic precedent?
In the past three cycles, milk production growth soared at an annual pace of around a positive 2%. Considering that the second half of 2022 saw milk production grow by 1% and December’s dairy herd remains larger than the year prior, there is no doubt that milk production will grow in 2023.
However, given other dynamics at play, such as on-farm margins and widespread base-excess programs, the growth is expected to be muted. Milk production may not be as high as we’ve seen in years past, but that doesn’t explain the entirety of the futures markets Class III and Class IV convergence.
What’s the cause?
Could the demand outlook for 2023 be favoring Class IV products relative to Class III? I would argue the opposite — the demand outlook is more favorable for Class III compared to Class IV.
Domestic consumption of cheese grew by a modest 1% last year while butter declined 7%. Additionally, cheese exports had their strongest year on record, growing by 12%, while nonfat dry milk was the only major export commodity to record negative growth in 2022.
What’s different about 2023 is where milk production is expected to grow. Constraints to production are not created equal. Milk production appears to be poised to grow in the Central region while the West faces an uphill battle. With the West likely experiencing another year of drought, the supply of homegrown feed will be scarce, putting pressure on feed markets and ultimately bringing input costs above and beyond those of other regions.
As an example, California milk production contracted slightly last year by 0.1%, while states like Texas, Idaho, Wisconsin, and New York all grew. This trend is expected to continue in 2023.
Varied product mix
Fluctuations in regional milk flows will have an impact on dairy commodity production. The Upper Midwest is a strong cheese producer, with Wisconsin and Minnesota responsible for roughly 35% of U.S. Cheddar cheese output, while California accounts for less than 10%. California, on the other hand, is the core producer of Class IV products, accounting for over 40% of the nation’s nonfat dry milk and over 30% of butter production.
If trends continue and we see significant regional divergences in milk production, the market reaction will be distinctly different from years past. In 2023, Class IV should be expected to feel reduced supply side pressures when compared with those of Class III. This market narrative would ultimately push Class IV prices higher for a second consecutive year. If this comes to fruition, don’t be surprised if the Class IV price finishes off 2023 with another $2 dollars plus premium over Class III.