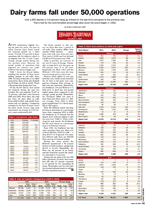
After moderating slightly during the past two years, the pace in which licensed dairy farms exited the business picked up a little steam. Overall, 3.8 percent of dairy operations left the industry which is up slightly from the 3.3 and 3.5 percentage change posted during the two previous years. However, the actual number of operations that departed our industry was under 2,000 for the third straight year.
Since 1992, the drop in licensed, or so-called commercial, dairy farms has declined 82,178 from 131,509 to 49,331. That's a 62 percent drop during that time.
Of the 82,178 dairies that exited the business during the past two decades, the vast majority, 57,497 or 70 percent, sold their cows between 1992 and 2002. Since then, the total has been cut more than in half. From 2003 to 2012, only 24,681 businesses left our industry. Comparing averages for the first 10 years versus the most recent 10-year time span represented an average of 5,750 versus a more moderated 2,468.
The farms counted in this survey are those that have a permit to sell milk. This number differs from another USDA estimate . . . operations with milk cows (even just one). That total is 58,000 and has declined 110,500 or 65.6 percent since 1992.
The tables in our March 10 issue on page 151 will provide a detailed overview of the last 21 years of change. Nationally, average herd size has gone up 154 percent, from 74 to 187 cows. Regionally, the West (+261) and the Midwest (+134) have seen the largest percentage gains in herd size.
Western herds added 33 cows per herd last year which nearly matched the 32 cows in the prior year comparison, bringing their average to 949 cows per operation. Meanwhile, the Southeast (+9) and Midwest (+7) both grew in herd size and posted higher gains when compared to the average yearly growth. Meanwhile, the Northeast added two cows to move herd size three short of a 100-cow average. From 2004 to 2012, gains ranged from 0 to 3 head annually in that region.
After the Midwest posted the largest drop in operations on a percentage basis when comparing 2011 to 2010, the Southeast at 5.6 percent had the largest share of farms calling it quits this past year. When evaluating the past decade, the Southeast lost the most dairies on a percentage basis in 9 of the last 10 years.
Since 1992, the Southeast has lost more operations than any other area as farms fell from 12,057 to 3,280 . . . a drop of 8,777 or 73 percent. Cow numbers followed suit; there are 669,000 fewer cows or a 53 percent drop.
During the same period, the Midwest experienced a 66 percent decline in herd numbers, going from 80,135 to 27,150. Meanwhile, the West lost 56 percent of its herds, and the Northeast posted the smallest reduction at 51 percent.
Among the top states with over 950 dairy operations (12 total), farm numbers fell only 3.5 percent compared to 5.5 percent for the remaining 38 states. Washington was the only state that bucked national trends by adding 10 dairy operations last year. Among states posting the largest percent drop in dairy farm numbers were: Texas, 15.3 percent; Nebraska, 14.3 percent; Oklahoma, 13 percent; and North Dakota, 10.3 percent. On shear numbers, Wisconsin lost 610 dairy operations which was a 5 percent loss when comparing 2012 to 2011.
For additional analysis for each state, see our March 10 issue.


