There is a reason that the federal government takes a detailed census each year . . . even going door to door to collect population data. It is the most accurate way to gather such information.
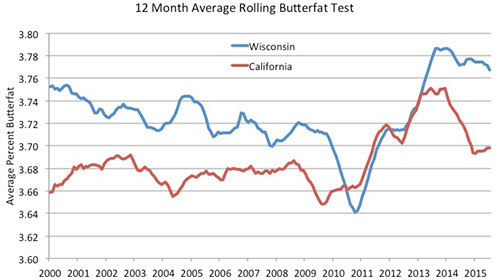
That being the case, we received a number of thoughtful responses on the September 21, 2015, Hoard's Dairyman Intel item "Wisconsin passes California in milk per cow." Perhaps, the most thoughtful comment submitted included a graph, shown with this Intel, that compared butterfat percentages between the two leading dairy states. Of course, butterfat percentages could be an indicator of breed because Jerseys have higher solids than Holsteins.
While we relied on DHIA herd and cow data, semen sales, and breed registration activity to arrive at our conclusion about the "browning" of California, the butterfat data is somewhat contrary to those thoughts. The pair of economists that shared the data weren't refuting the changing breed composition that now has a splash of Jerseys mixed with Holsteins in California, but they did point out that both states have relatively high component levels that are important for converting milk into cheese.
Interesting, even though it appears that California has a higher Jersey population, the Golden State as a whole has a slightly lower butterfat percentage as shown in the graph.
"From 2010, the average fat content for Wisconsin milk is 3.733 compared to 3.7086 for California," said Brian Gould, a professor with the Department of Agricultural and Applied Economics with the University of Wisconsin-Madison. "From a statistical point of view, these percentages are not different from one another," he went on to say even though Wisconsin has a slightly higher component level.
Over a longer window, January 2001 to July 2015, Wisconsin had higher butterfat content at 3.724 contrasted to 3.687 for the Golden State. From our point of view, the rise in California does coincide with its growing Jersey population.
That butterfat comparison is based on a monthly survey by USDA's National Agricultural Statistics Service based on milk received at plants. We want to thank Mark Stephenson, director of dairy policy analysis, for gathering the data in the chart.
While butterfat gives some indication to breed composition, other factors also play a role in milk composition. Those factors include ration, heat, humidity and other environmental factors.
"The (milk composition) data does not support that Wisconsin cows are producing thin, watery milk," noted Stephenson in sharing the graph even though the California breed composition may be changing more than in Wisconsin. "On a per hundredweight basis, the butterfat level is still consistently higher, as determined by the monthly NASS survey of milk received at plants."
(c) Hoard's Dairyman Intel 2015
September 28, 2015


