The author is the managing director for IFCN Dairy Research Network.
In the last 11 years, the world dairy market has been hit by three major downturns and had two milk price booms. In early 2017, the latest world milk price crisis came to an end.
With this in mind, we will identify the key developments and the main drivers of the world dairy market and draw conclusions for the U.S. dairy industry. In this article, I will draw heavily from the IFCN Dairy Research Network, a global network of dairy researchers from over 100 countries and of about 120 agribusiness related companies/dairy institutions. The network conducts comprehensive dairy economic analysis for creating a better understanding of the dairy world.
World milk price cycles
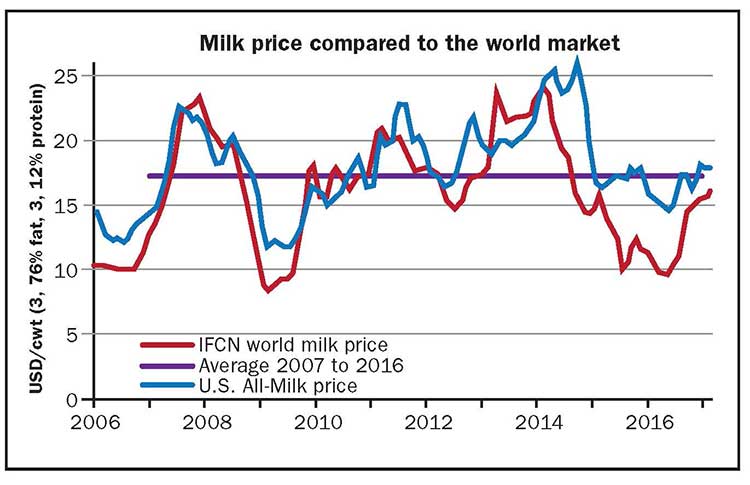
The development of the world and U.S. dairy prices is shown in the charts. The IFCN World Milk Price is based on the weighted average of three IFCN World Price Indicators: skim milk powder and butter (35 percent), cheese and whey (45 percent), and whole milk powder (20 percent). This converts the global dairy commodity prices into a global “farm gate milk price indicator”
Since 2007, the world milk price has ranged from low prices of $8.40 per cwt. based on the U.S. dollar for milk with 3.76 percent fat and 3.12 percent protein to over $24 on the world stage. On average, this price was $16.60 per cwt. during the period of 2007 to 2016. But to tell the entire story, the last 10 years should be divided into four phases:
Phase 1 (duration: 3 years; 2007 to 2009): This was the first roller-coaster scenario with milk prices as low as $8.40 and price peaks of $23.30 per cwt. on the world level. The price fluctuation was nearly 50 percent plus or minus the mean. The start of this cycle was driven by global demand which was growing faster than worldwide supply in 2005 and 2006. Due to the low milk supply in 2009 and a strong demand in late 2009 on the world markets, world prices recovered.
Phase 2 (duration: 1 year; 2010): In this period world milk price was quite stable with a fluctuation of only plus or minus 10 percent. This level of stability was driven by the high level of stocks at the end of 2009 that gave the market a certain floor until they were gone.
Phase 3 (duration: 2 years; 2011 to 2012): In this period, world milk price showed a moderate volatility of plus or minus 20 percent. In this time, world milk supply and demand have been growing at a similar rate and minor imbalance existed.
Phase 4 (duration: 4 years; 2013 to 2016): A new roller-coaster scenario started to occur with high world milk prices in 2013-14 and low prices in 2015-16. This fluctuation at plus or minus 50 percent equaled Phase 1. So far it looks that this phase has ended in 2016 or will end very soon as world milk price reached almost $16 per cwt. in February 2017.
The key driver that triggered this phase was the low milk supply in 2013. Bad farm economics, especially in 2012, and poor weather conditions reduced world milk supply growth in 2013 down to 0.5 percent growth per year. A benchmark: an annual growth rate normally lies around 2 to 2.5 percent.
This phase also was longer than Phase 1, as the European Union’s quota abolishment provoked additional milk supply despite very poor farm economics. The end of this phase was driven by a milk supply reaction, especially in Europe, Latin America, and Oceania.
Impact on the U.S.
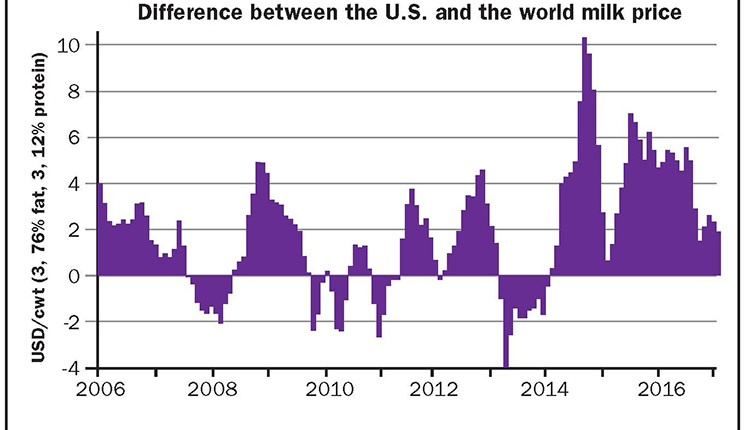
In Phase 1, U.S. milk price was following the high and low price levels of the world market. In contrast to that, the pattern of Phase 4 was quite different. In 2014, U.S. milk price remained substantially higher than on the world market . . . by up to $10 per cwt. In the years 2015 and 2016, the price gap between U.S. and world milk prices was a level $4 per cwt. This means that U.S. dairy farmers got a 40 to 50 percent higher milk price compared to farmers in countries that are more connected to the world market.
By the end of 2016 and early 2017, this gap was reduced to a level of $2 per cwt. as world milk price recovered. In comparison to other countries, the U.S. dairy farmers were much less affected by low milk price than farmers throughout Europe and Oceania.
It has to be considered that, in general, the farm gate milk price counts for roughly 80 percent of the production costs for dairy commodities. This means for a processor that dairy products are more competitive internationally if the farm gate milk price of their country is similar to the world price level. As the milk price in the U.S. was in the last three years substantially higher than on the world market, this led to
a. Fewer exports
b. More imports
c. Decline in self-sufficiency from 107 percent in 2013 to 104 percent in 2016. The calculation is based on milk equivalents using the fat and protein solid method.
IFCN is monitoring the relationship between national and world milk prices in over 60 countries on a monthly basis. Countries with a high self-sufficiency rate such as 115 percent or more in the European Union (EU) have little chance to disconnect their national milk price from the world price. Countries with a self-sufficiency rate of 105 percent or less might have a chance to disconnect from the world market.
What we learned
- The world milk price creation is a result of world milk supply, demand growth, and the balance of global export supply and import demand. The world milk price is affecting national milk prices in every country in the world.
- The world milk price is very volatile, moving plus or minus 50 percent. This is mainly driven by the time delay of how fast world market prices get transmitted to national markets and consequently when farmers and consumer react on world prices.
- The U.S. All-Milk price in the last three years was substantially higher than the world market price. U.S. dairy farmers benefitted from a higher and more stable milk price than farmers in the EU or Oceania. On the other hand, U.S. dairy exports have dropped and dairy imports (in milk equivalents) have climbed


