When every dollar counts, dairy producers must decide where to invest their time and resources. For some, hiring custom operators for cropwork and manure hauling allows them to focus on the dairy side of the business without spending a lot on equipment that is only used certain times of the year.
To get a feel for what is being charged for these services, Wisconsin’s National Agricultural Statistics Service field office conducts a statewide survey every couple of years. Just over 700 surveys were compiled in 2017 from farmers who hire custom operators, custom operators and farmers who performed custom work, and machinery dealers who rent out equipment.
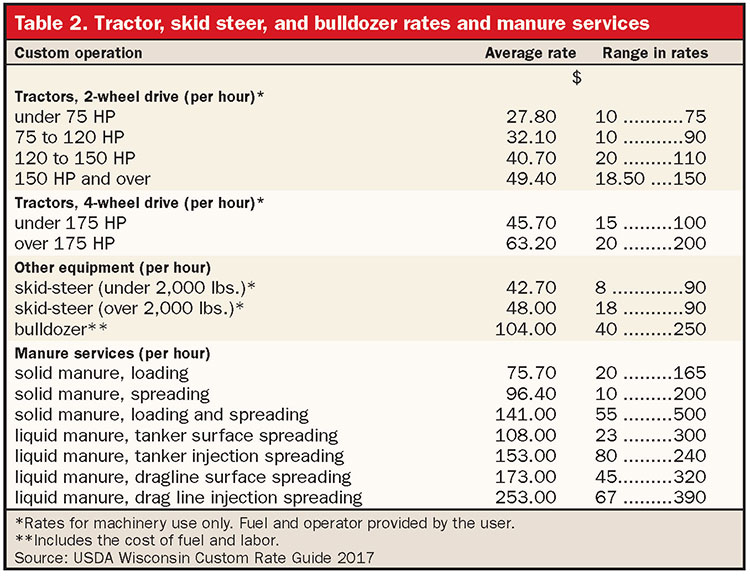
The rates in this article are ranges and averages of actual reported data for 2017. In these tables, most of the rates include the cost of hiring the machine with fuel and operator, but exclude the cost of any materials. Tractor data found in Table 2 is based on only rental rates and excludes fuel and operator. The same situation applies for rental of silage bagging equipment shown at the bottom of Table 4. Meanwhile, the costs for bulldozing in Table 2 do include the cost of fuel and labor.
Reports were edited to remove replies for which the respondent’s figures were widely outside the range of other answers. The ranges provided for each category encompass at least 90 percent of the reported values.
Rates are typically influenced by fuel costs, soil conditions, topography, field size and shape, and type, age, and availability of equipment. Please keep in mind that machinery, fuel, and labor prices may have changed since the data was collected. Enough time has lapsed since the survey was initiated that fuel prices could cause rental rates to go up this year.
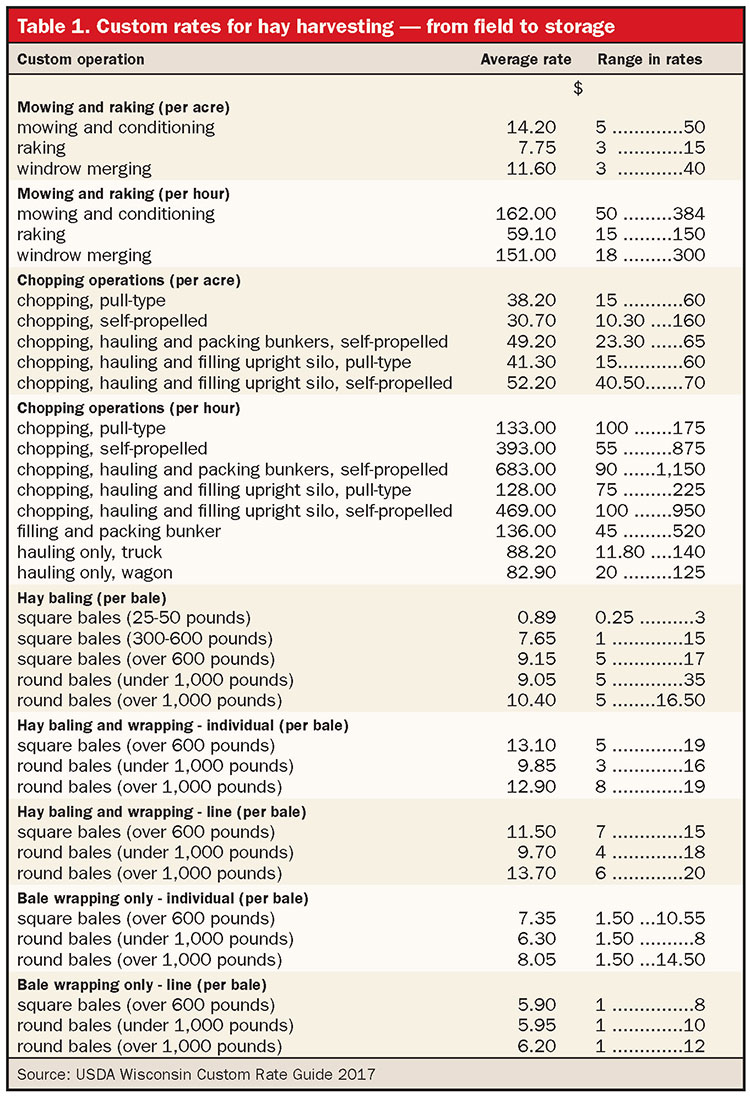
Table 1 includes field and storage practices performed on hay, while Table 4 involves corn silage. The bagging information in Table 4 applies to both hay and corn silage.
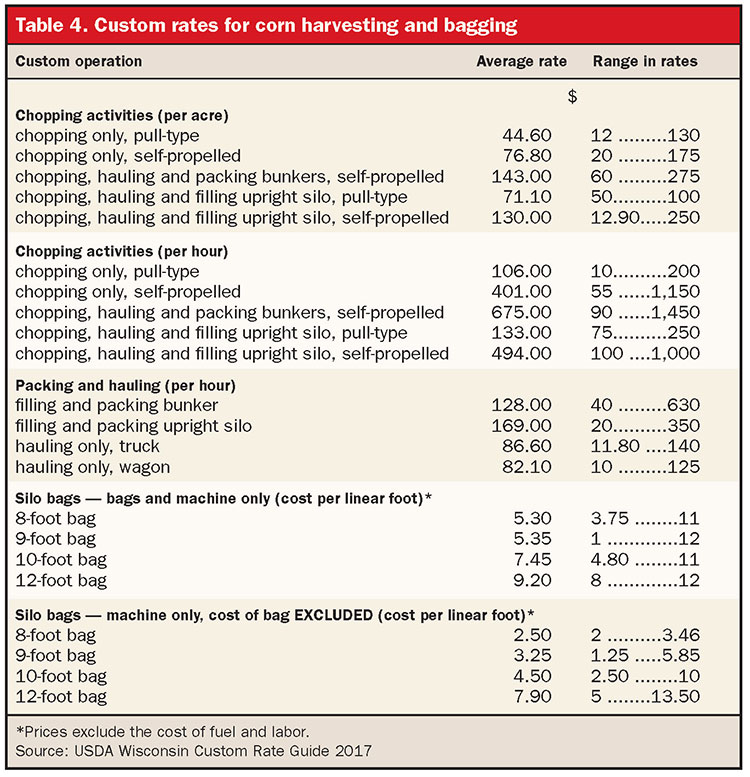
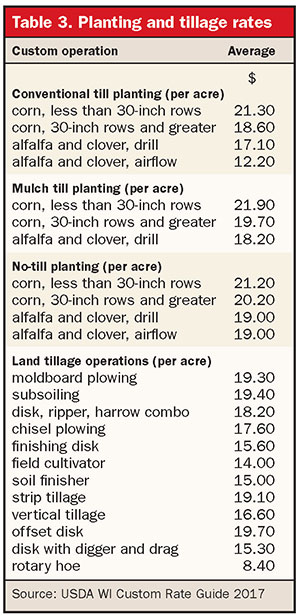
When studying the tables, be sure to look at the bold heading found above each item. In parenthesis, you will find how each item is priced: by the acre, by the hour, by the bale, or per linear foot (silo bags). We only included rates more specific to dairy. A complete report can be found by going to www.nass.usda.gov/wi and clicking on “Wisconsin Custom Rate Guide 2017.”
Custom rates will vary depending on your location. There are other states that conduct similar surveys in order to assess custom rate values in their location. For a listing of other state’s custom rate guides and the date they were last updated, visit on.hoards.com/HFGcustomrateguides.