For this column, I’ve pulled data from CDCB (Council on Dairy Cattle Breeding) genetic evaluation files from January of 2009 and from our most recent evaluation of December 2018. There were 623 Holstein sires that had no daughters in 2009 and now have at least 250 currently.
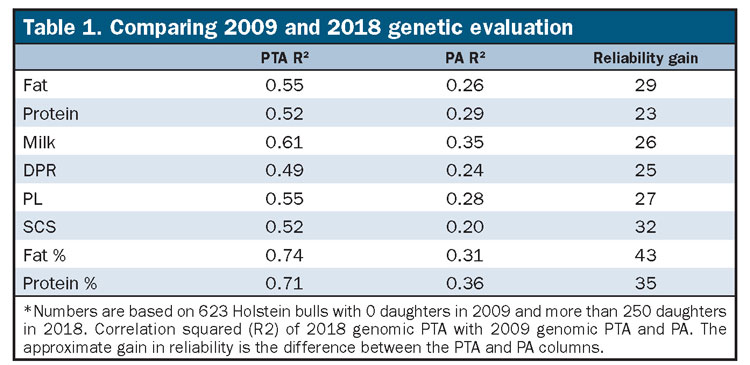
I’ve presented the correlation squared (R2) of our bull’s 2018 PTA (predicted transmitting ability) for selected traits with their PTA and parent averages (PA) from 2009. I’m reporting the correlation squared because it can be considered approximate to what I will refer to as the “realized reliability.”
The average published reliability for these bulls’ PTA milk in 2009 was 71 percent whereas our realized reliability was 61 percent. There are a few reasons why realized reliabilities are expected to be somewhat lower than published numbers that we won’t detail here.
The most important consideration is whether we achieved the gains in reliability that were expected when genomic PTAs are compared with PAs. The reliability gains were mostly around 30 percent, which is well within the gains that were promised in 2009.
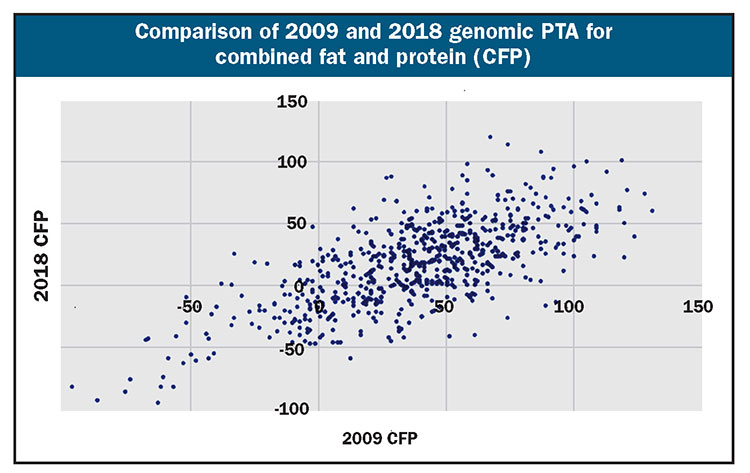
Another way to visualize how well our early predictions performed is to consider the chart that contrasts 2009 genomic PTA (adjusted to our current genetic base) with the current evaluation. I’ve combined PTA for fat and protein into a single number (CFP or combined fat and protein) for simplicity. It is apparent that the trend is in the expected direction, but there are outliers that are better or worse than we initially thought.
Provides some warnings
The numbers in Table 1 and our chart tell us that our genomic methodologies are good when viewed over a large population of animals. The picture shifts some when we start looking at individuals.
You’ll notice in the graph that the top 2009 bull is still very good but no longer in the top handful of bulls. This is problematic because the top few bulls have many more daughters than the next tier.
When it comes to the genomic heifer market, the dollar value between the top percentile and second percentile may be five figures. I’m not certain that is justified when one looks at our chart, but I might feel differently if I happened to be the breeder of the top tier heifer!
Another way to look at this is to compare how the top tier of bulls ranks today in contrast to 2009, which we’ve done in Table 2.
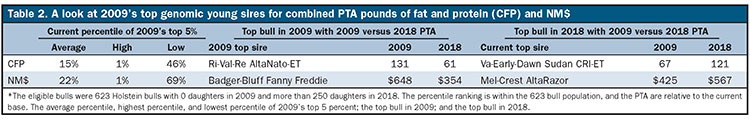
We’ll consider the top 5 percent of our 2009 bulls as the “elite” tier. Based on today’s PTA for CFP, they are in the top 15 percent on average. That’s good, but it’s not the top 5 percent. As you might expect, there are some still at the top, but some are merely at the average of the 2009 bull population. The top 2009 bull (Ri-Val-Re AltaNato-ET) slipped from 131 CFP pounds to 61 CFP today. In contrast, Va-Early-Dawn Sudan CRI-ET went from 67 to 121.
A look at Lifetime Net Merit $ (NM$) tells a similar story. The NM$ formula has changed over time with the addition of new traits such as livability and with changes to milk price. That means that comparing 2009 NM$ to 2018 NM$ is not an apples-to-apples comparison. Nevertheless, we certainly hope that there is some stability over time.
As you can see, the top 5 percent of 2009 bulls are now in the 22nd percentile with some bulls that are below average. Again — the general trend is good, but there were significant outliers. Two bulls were tied for the top of the pack in 2009, but I only included the one that is currently the best. Badger-Bluff Fanny Freddie is still a very good bull from that era and in the top 5 percent. Mel-Crest AltaRazor improved once his daughters began milking and is now the top NM$ bull from that era.
The challenge of bulls at the top of the chart shifting can be demonstrated by comparing the number of Freddie sons — 929 in the CDCB database — to AltaRazor who only has 21 sons. We’d probably like to see a bit more balance in retrospect. Some of the reason for shifting NM$ also relates to inbreeding and relationship to the breed. Freddie has a genomic future inbreeding of 9.3 percent, whereas AltaRazor stands at 7.9 percent. Our bull proofs are discounted to some extent to favor bulls with lower genomic future inbreeding, but that alone does not account for all the change we see when comparing these two bulls.
Lessons for today
It is important to keep in mind that our genomic PTA have become more accurate over time — how much so we’ll know in another decade. There are two points I hope you can take away from this look back to 2009.
First, genomic predictions do work and give us the boost in reliability that was generally expected. More importantly, I think the numbers tell us we would be better off to spread matings that generate the next generation of sons across a wider selection of sire and dam lines. It would certainly benefit us from an inbreeding standpoint.
The trouble is, competition in the A.I. industry is intense and marketing second tier bulls will not work. Until producers demand semen from bulls with low genomic future inbreeding, that is a problem that will not go away.