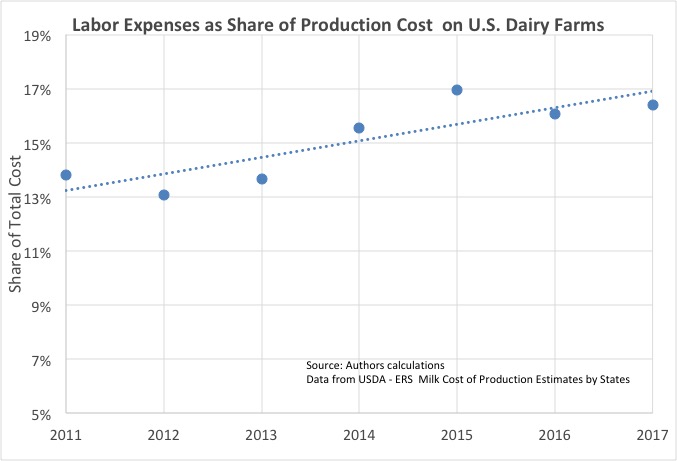
Labor costs have grown over the last years, reveals USDA data on the cost of production on dairy farms. In 2011 to 2012, labor represented about 13 percent of total expenses on average U.S. dairy farms. That number rose above 16 percent between 2015 and 2017.
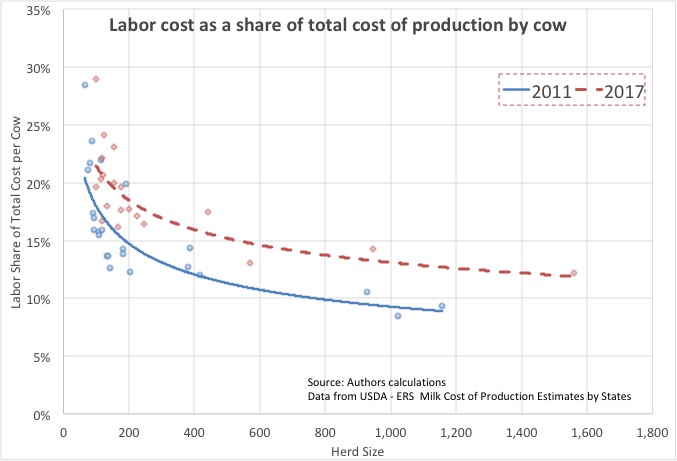
It is also well known that labor expenses per cow or per hundredweight, when including the value of the operator’s labor, is much higher for smaller farms. The figure below shows that in 2017 labor expenses accounted for more than 20 percent of total cost for smaller herds and about 12 percent of total cost for larger ones. This was higher than in 2011, when labor represented between 15 percent and 20 percent of cost for smaller herds and less than 10 percent for larger ones.
The cost of labor seems to have jumped more drastically for larger herds relying heavily on hired labor. Of course, tightening labor markets due to the immigration situation, historically low unemployment rates, and expanding U.S. economy can explain much of that upward change.
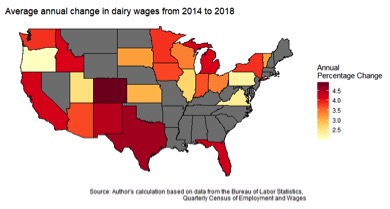
Looking at the change in dairy wages across states, we can see over the last four years annual increases of 4 percent to 5 percent were typical in the South, while annual increases around 3 percent were more common in the Midwest and Northeast. This can be explained in part by the expansion of dairy herds in states like Texas and New Mexico over that period, which was more pronounced than in Northern regions.
