In your March 25, 2019 issue . . .
THE OUTLOOK FOR THE SECOND HALF of the year continued to show promise with July to December Class III futures contracts trading near a $16.30 average. Class IV contracts during that time netted $16.60.
USDA ECONOMISTS CONCURRED by projecting a $17.30 All-Milk price for 2019 with a $17 to $17.60 range, up 5 cents from their February analysis.
MILK PRICES COULD REACH an $18-per-cwt. equivalent in New Zealand due to strong global demand. Its Global Dairy Trade auction climbed seven straight sessions dating back to December 4. U.S. prices have lagged because it lacks free trade agreements held by the Kiwis and EU.
DISMAL DAIRY PRICES STILL PREVAIL for the moment as farmers who sign up at the $9.50 per cwt. coverage level in the new DMC program would receive a $1.51 payment for January milk. Turn to page 188 to learn more.
HEIFERS REMAIN IN AMPLE SUPPLY despite producers culling an additional 160,000 cows from the national dairy herd last year.
THERE WERE 4.7 MILLION HEIFERS in the U.S. (over 500 pounds) this January. That number is identical to inventories five years ago.
U.S. EXPORTS REACHED A RECORD 15.8 percent of U.S. milk solids production, and the U.S. reclaimed the title of the world’s largest single-country cheese exporter. Retaliatory tariffs placed by Mexico, China, and other countries slowed sales during the second half of the year.
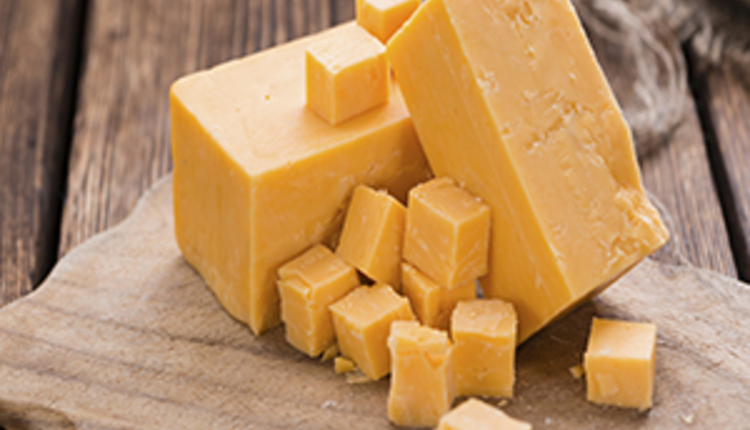
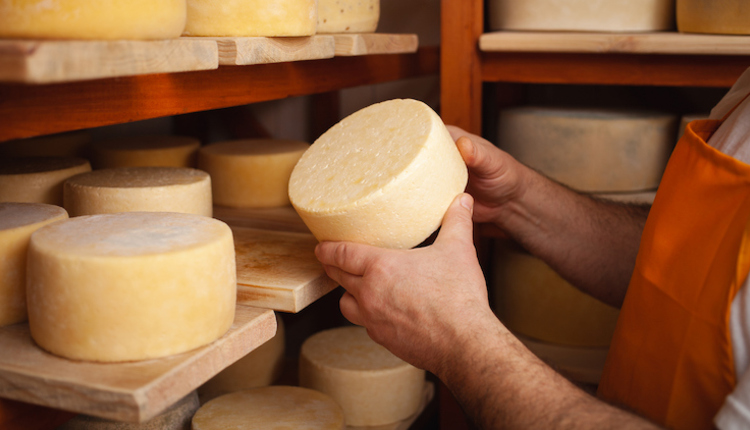
CHEESE OUTPUT POSTED A NEW RECORD for the 27th straight year. In 2018, production grew 2.1 percent to pass 12.9 billion pounds. Since 1990, cheese has more than doubled from the 6 billion-pound mark.
MOZZARELLA ACCOUNTED for 33.5 percent or 4.3 billion pounds of all cheese, while Cheddar’s share was 28.8 percent or 3.7 billion pounds.
BUTTER BOOMED ALL THE WAY BACK by breaking the 1941 all-time production record of 1.87 billion pounds. Last year, manufacturers produced 1.88 billion pounds of butter. That also made 2018 the seventh straight year that butter topped the 1.8 billion-pound threshold.
MILK QUALITY IMPROVED as somatic cell counts (SCC) dropped to 191,000 cells per mL last year among herds on Dairy Herd Information Association (DHIA) testing programs. Ten years ago, SCC was 233,000.
CLASS I OR FLUID USE across all federal orders fell to 29 percent last year. Class II (yogurt and soft products) held at 13 percent. Meanwhile, Class III (cheese) showed the strongest growth, climbing to 43 percent, while Class IV (butter and dry products) held steady at 15 percent.
USDA IS SEEKING NOMINATIONS for the National Dairy Promotion and Research Board. Call USDA at 202-720-1069 for more details.
In your next issue . . .
HOMEBRED COWS HEADLINE CONTEST.
From the Atlantic to the Pacific, the cows in this year’s Hoard’s Dairyman Cow Judging Contest can be found in tie stall, robot, and parlor herds.
EACH CASE OF LAMENESS HAS A UNIQUE COST.
Individual cow factors, such as age and stage of lactation, can all influence the true cost of lameness.
UNITY BEGINS WITH YOU.
In difficult times like these, cooperation and teamwork are needed; small positive steps can bring us together.


