With a $15.72 average, last year’s mailbox milk prices fell $1.59 per hundredweight (cwt.) in just one year from the 2017 price of $17.31. Given those levels, the milk payments received by dairy farmers were only $2.90 above 2009’s disastrous dairy prices when milk checks averaged $12.82.
The difference in that era?
In 2008, mailbox milk prices netted $18.40. Meanwhile, in 2010, payments for milk averaged $16.29 per cwt.
Why mailbox milk prices matter
Mailbox prices reflect the actual price dairy operators receive for their milk, hence the name mailbox price. Typically, they are released about 3-1/2 months following the month for which the prices apply. Mailbox prices are reported at average fat tests and reflect all premiums, as well as marketing costs, including hauling.
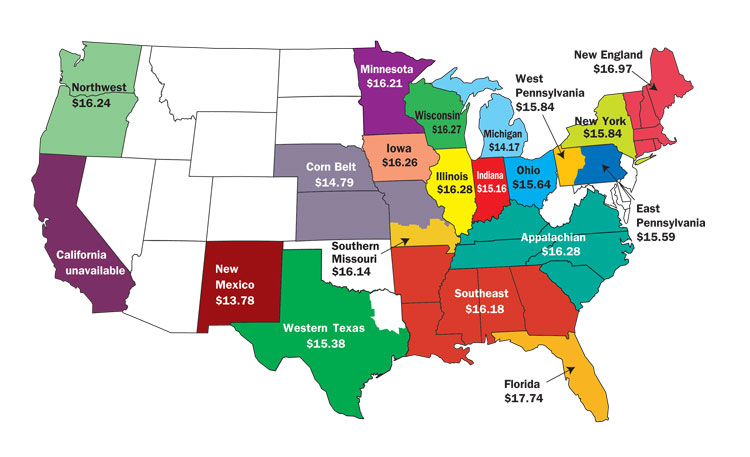
To compare your mailbox price to those in the maps, simply add back any voluntary deductions from your check . . . such as supplies, association fees, or other assessments.
Florida has the country’s highest milk price at $17.74. That value was driven by the country’s highest Class I milk use for beverage products. Overall, 84 percent of Florida's milk goes to bottling.
However, Class I isn’t the only driver.
In Wisconsin and Minnesota, only 9 percent of milk goes to Class I use. Those states ranked fifth and eighth, respectfully, among all regions for 2018 mailbox prices as 11 regions were lower than Minnesota.
Western Pennsylvania and Ohio lost the most ground when compared to other regions . . . each dropping five spots when comparing 2017 to 2018.
Promise quickly faded
The year initially showed promise for U.S. dairy farmers. Then trade battles with America’s top three dairy trade partners — Mexico, China, and Canada — sent international dairy product sales skidding, and the forecasted milk prices for 2018 never materialized. As a result, dairy farmers received the lowest payments for their milk since the 2009 downturn.
Referred to as domestic commercial disappearance, purchases by U.S. consumers climbed to 211.9 billion pounds of dairy products on a milkfat basis. While that was a new record, domestic sales grew only 0.6 percent during the past year when compared to 3.1 percent two years earlier. Bright spots on the home front were cheese, up 2.3 percent, and butter, up 2.1 percent. Sales for both fluid milk and yogurt ended the year on a down note.
Globally, all dairy exports grew 2.9 percent last year, but American exporters experienced uneven growth. While the U.S. exported a record 15.8 percent of its products, robust sales at the onset of the year tapered off significantly. Those slowed sales took place because leading dairy product importers slapped retaliatory tariffs on many farm commodities.
For that matter, 2019 is off to a very slow start on the export front, as January 2019 exports tumbled due to retaliatory tariffs placed on U.S. dairy products by China and Mexico. Overall, Chinese purchases plummeted 41 percent when compared to last January. Cheese sales to Mexico were off 20 percent. Overall, exports represented 12.5 percent of January’s U.S. milk production — the lowest in nearly three years.
Ultimately, slow growth in domestic sales, volatile exports, and Europe’s strong product inventories all worked to hold U.S. milk prices at bay during 2018.


