The 2019 corn silage crop appears to have potential based upon early sample analysis summaries. However, the key word in this introduction is “potential.” Just like a 10-foot tall pile of firewood has the potential to yield a heap of heat, the potential must be achieved in order for the energy to be realized.
For some growers and producers this year, higher quality corn silage on paper may in actuality behave like a massive pile of green firewood.
Green firewood doesn’t burn
In nutrition talks, I’ve described wet or green firewood as having exceptional potential. However, that potential doesn’t always equate to reality. For those who have wood stoves, fireplaces, or fire pits, we recognize green firewood doesn’t burn well. The fire never has a chance to get started, thus the energy can’t be realized despite the potential being there.
In the same way, corn silages chopped and packed in late 2019 might have many of the same issues. This is challenging for some to grasp, but hopefully this article will help explain how a nutritional disconnect between potential and performance can happen.
Fiber and starch paramount
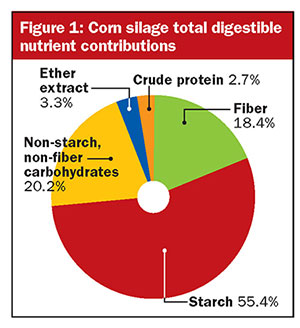
One can clearly visualize in Figure 1 that total digestible starch and total digestible NDF represent nearly 75 percent of the variance in TDN, and subsequently in milk per ton as well. This means that roughly 75 percent or more of your corn silage quality is defined by digestible fiber and starch.
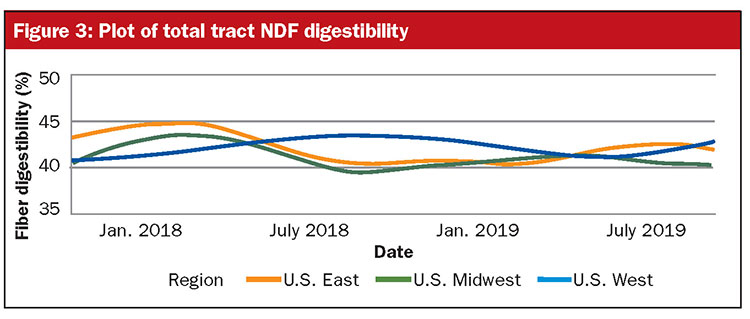
With fiber, starch, and the digestibility for each in mind, we can quickly review the 2019 crop in Figures 2 and 3. Fiber and starch content (data not shown) in this year’s crop appear to be relatively consistent for growers from the eastern to western U.S., with fiber content slightly higher in the Midwest and Eastern regions.
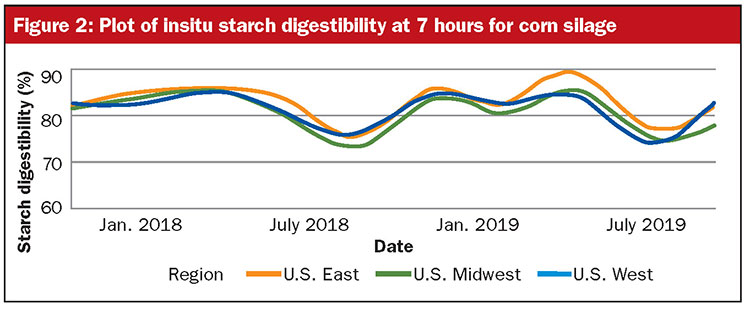
While starch to fiber (or grain to stover) ratios appear relatively consistent, fiber and starch digestibility appears to have risen for new crop samples relative to the past year in the Midwest and East (Figure 2 and 3). Thus, TDN and quality potential appears to be up. However, as acknowledged above, some farms will not be able to recognize this potential.
Feed testing laboratories analyze samples in isolation from what dairy cows actually consume in the total mixed ration (TMR). Therefore, the laboratory technicians only assess the chemical and nutritional value on a basic level. Anti-nutritional and management factors that disrupt rumen metabolism and detract from performance, like wet or green firewood, aren’t taken into account by routine feed analysis reports.
In the past five years, we’ve improved our understanding of feed hygiene risk factors that rob TMRs and corn silage of their full nutritional value. In the last several months, this recognition has intensified with firsthand experience helping troubleshoot on farms. Here are a few of the leading concerns we’ve encountered:
- Ear and stalk rot prevalence increasing mold, yeast, and mycotoxin contamination in silage
- Delayed harvest and heavy rainfall raising mud and ash contamination in silage
- Harvesting in cold or freezing temperatures, limiting fermentation and feeding potential
- Other contaminated feeds being introduced around the same time as new crop corn, such as moldy or rancid soybeans or by-products
Substantial rainfall and weather events also can affect dairy performance beyond what many recognize. Consider the following example with a progressive dairy that aggressively checks moisture levels in their silage piles three to four times per week. After a multiple inch rainfall event in a two day period on this farm, the dairy recognized a four unit bump in moisture content.
This continued for all forages on the farm for over a week, following the rainfall event. The ration impact on an as-fed basis was well beyond what many farms estimate and adjust for. A rise in moisture not only changes forage dry matter and feeding rates but can also contribute to higher rates of wild yeast growth due to greater water activity.
With the general crop observations in mind, seek to understand both your crop’s potential and recognized quality. If quality and performance aren’t up to expectations, consult with your nutritionist and veterinarian to identify the disconnect.