In your September 10, 2020 issue . . .
COULD DAIRY’S “V-SHAPED” RECOVERY transcend into a “W-shaped” price swoon? If shifted from a “V” to a “W-shaped” graph, the markets would face a second price downturn fueled by oversupply of milk, lighter dairy product demand, or a combination of both market metrics.
“WE ARE NOT OUT OF THE WOODS on that yet as one looks to the fall and potential milk prices next year,” stated NMPF CEO Jim Mulhern. “The last thing we need is a big increase in milk production.”
JULY POSTED THE LARGEST GAINS in U.S. milk production since the pandemic erupted in the United States. Milk for the month rose 1.5%, the highest since March when year-over-year milk climbed 3%.
SOUTH DAKOTA LED THE MILK BRIGADE as July’s output rose 11.5%. Indiana climbed 6% and Colorado was up 5.8%. On the flip side, Florida dropped 5.7%, with New Mexico and Vermont close behind at 5.3%. The two largest milk sheds, California and Wisconsin, rose 0.5% and 0.6%.
SEPTEMBER-TO-DECEMBER CLASS III FUTURES averaged $16.05 in late August trading. The first six months of 2021 traded near $16.20. Those contracts would net cheese prices well above prevailing world prices.
CLASS IV BUTTER-POWDER CONTRACTS have traded far closer to world price levels with a $14 net for the final four months of the year and a $15.20 average for January-to-June futures on the CME.
“POST-LOCKDOWN DAIRY DEMAND is both fantastic and terrible,” said StoneXGroup’s Nate Donnay. “Retail sales of natural cheese are running strong . . . still up 12% to 13% from last year through the first half of August. Meanwhile, food service sales are still down 15% to 20%.”
WHEN LOOKING AT TOTAL U.S. DAIRY DEMAND, which would be domestic sales, exports, and government purchases, sales were up an amazing 3.9% from last year June, continued Donnay. June exports were up 33%, while government purchases skyrocketed 2,241%.
“IF YOU NARROW THE DATA to just commercial domestic purchases, removing exports and government purchases, then the demand numbers look pretty terrible, down 3.5% from last year in June,” said Donnay.
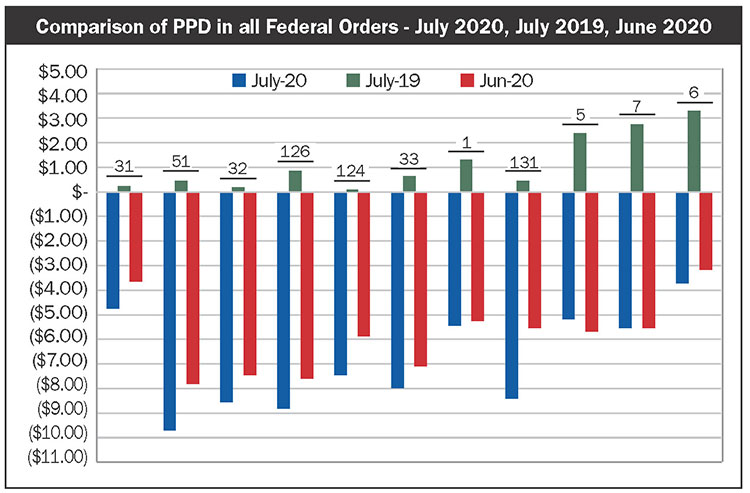
NEGATIVE PRODUCER PRICE DIFFERENTIALS (PPDs) continued to strip money from milk checks. In June, federal order pools were short $527 million and July sunk further to $667 million, for a combined $1.2 billion.
“THIS SHORTFALL CAUSED RECORD-LOW FMMO minimum milk prices across the U.S. that showed up in dairy farmer’s milk check as negative producer price differentials,” said Farm Bureau’s John Newton. The graph by Cornell’s Andy Novakovic shows those PPDs by order.