In your May 2021 issue . . .
DAIRY WAS ONE OF THE EARLY pandemic powerhouses of 2020,” said Eric Richard. “Very early on, sales for milk, cheese, and eggs spiked to unprecedented heights. It’s hardly surprising to see that 2021 sales could not keep pace with those enormous spikes in sales.
“HOWEVER, DAIRY DEMAND remains robust with sales in each week of March easily exceeding the 2019 prepandemic baseline,” continued the industry relations coordinator with the International Dairy Deli Bakery Association on sales in grocery stores and other retail outlets.
THOSE STRONG SALES PROPELLED CME futures. May-to-December Class III contracts averaged $19.30 in early May, with June and July being peak months. In early February, the same group netted $17.20.
CLASS IV TAGGED ALONG as the contract bundle for the final eight months garnered $17.30 per cwt. Unlike Class III, the strongest months were at year’s end. In February, that group averaged $15.60.
MOST OF THOSE GAINS were being muted by rising feed costs as corn futures pushed into the $6.75 per bushel range, up from $5.50 in February. Soybeans mirrored that story with futures moving from $13.70 to $15.30 per bushel. Early indications are that the hay crop looks good.
CORN CONTINUED TO CLIMB for a number of reasons: the prevailing notion that the final year harvest was overstated, low grain stock reports from USDA in recent months, and strong export activity.
DOMESTIC DAIRY DEMAND should continue to climb. “As a growing share of the population is vaccinated and as restrictions get lifted, food service channels anticipate a demand jump,” said Rabobank’s Ben Laine.
“FOOD SERVICE PIPELINES ARE GEARING UP for elevated activity and reopenings, leading to the current strong product pull,” continued Laine. “Looking ahead, once we settle into post-vaccine demand patterns, prices might cool somewhat from this initial restocking phase.”
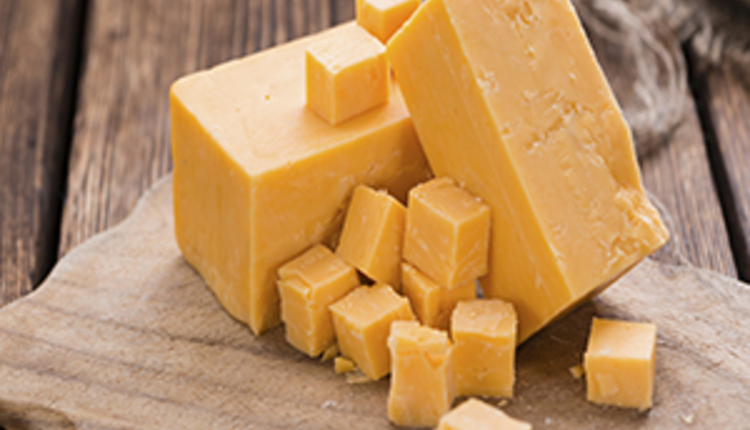
THE PRODUCT PULL looks much different than a decade ago, with full-fat dairy products leading in the sales gains. As a result, butterfat levels reached 3.95% in 2020. Just a decade earlier, U.S. milk averaged 3.66%.
THE 3.95% BUTTERFAT CONTENT in last year’s milk supply has been pushing historic highs in USDA data tracing back to 1924. U.S. butterfat content averaged a record 3.98% during the height of World War II.
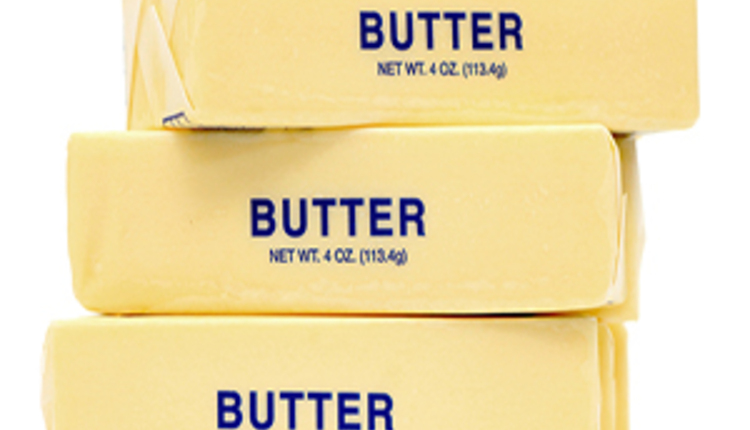
“SINCE 2000, THE PROTEIN PRICE has contributed 49% of the component value of milk, while the butterfat price has contributed 44%,” wrote John Mykrantz in an analysis of the Pacific Northwest federal order. “The other solids price has contributed the remaining 7%.
“UNDER CURRENT FEDERAL ORDER FORMULAS, when the price of butter increases 1 cent relative to the butter price, the protein price decreases by 1.3 cents,” continued Mykrantz. “When the price of cheese increases 1 cent relative to the butter price, the protein price increases 3.2 cents,” he said of price formulas dating back to October 2008.
DRIVEN BY HIGHER FEED COSTS, the Dairy Margin Coverage (DMC) program once again made payouts in March. While the All-Milk price climbed by 30 cents from February to reach $17.40, the final feed cost formula moved from January’s $10.36 to $10.94 in March. Those insured at the $9.50 coverage will receive $3.04 per cwt.
DAIRY REPLACEMENT PRICES moved upward ever so slightly. In April 2020, springers fetched $1,250, while April 2021 was $1,310.