The year that was 2020 will long be remembered as a year when the unthinkable happened . . . a global pandemic that nearly halted economic activity for a period of time. No one could have predicted the far-ranging effects felt by the dairy industry and other agricultural and food sectors. The federal government stepped up quickly to help agriculture, including dairy producers, by offering different programs to help offset the economic damage being done by the pandemic.
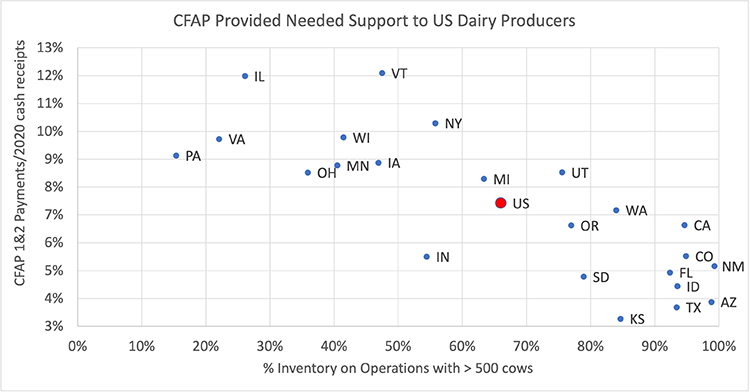
As many parts of agriculture are continuing to recover, a look back at the delivery of pandemic aid to the industry can be instructive. The graphic provides a look at how the direct payments producers received through the Coronavirus Food Assistance Program (CFAP) affected different dairy producers in different states. This graphic focuses on the largest 25 dairy states and examines the percentage of CFAP payments . . . both Rounds 1 and 2 . . . relative to 2020 market cash receipts.
Among the largest government outlays in decades
First, on a U.S. basis, CFAP payments made to-date equal about 7.5% of 2020 dairy cash receipts from marketing. This amounts to some of the largest government outlays seen in decades. The graphic shows that, on a state basis, CFAP had differing effects. For Vermont, CFAP payments were 12% of market cash receipts, while in Kansas, CFAP payments were a little more than 3% of cash receipts.
Some interesting observations also can be made when plotting the CFAP payments for each state as a percentage of cash receipts relative to the percentage of their dairy cow inventory that resides on operations with more than 500 dairy cows shows. This exercise shows that the payment limits used in making CFAP payments certainly had an effect on a state’s level of CFAP payments relative to cash receipts. The correlation between these two categories is nearly -0.8. The dispersion of the data in the graphic reminds us that while payment limits were important, there were also other factors at play in determining the CFAP payments received by individual states.
This graphic is not meant to suggest that the CFAP approach was somehow incorrect. It only provides a look back and a chance to think further about how to best provide support to the dairy industry if future catastrophic events were to unfold.