
USDA’s most recent net farm income forecast, released in December, anticipates overall net farm income will hit the highest inflation-adjusted level since 1973, climbing $10.7 billion across the broader farm economy, a 7.2% gain over last year. Receipts for dairy products and milk, specifically, are expected to move from about $42 billion in 2021 to nearly $58 billion in 2022, primarily on the strength of higher milk prices.
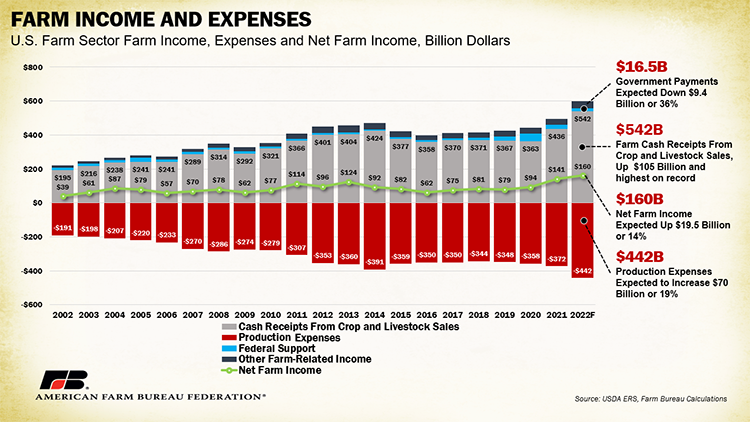
A quick glance at these rosy statistics, coupled with decent demand signals, might suggest dairy farmers are in good shape — and some are. However, many others are feeling the record rise in production expenses . . . up $70 billion, or 19% over 2021 as shown in Figure 1 . . . wiping away the promise of workable margins. Those able to cover expenses are hard at work paying down debt and losses from previous years. Both regional variability in weather and regulatory dynamics pose further uncertainty.
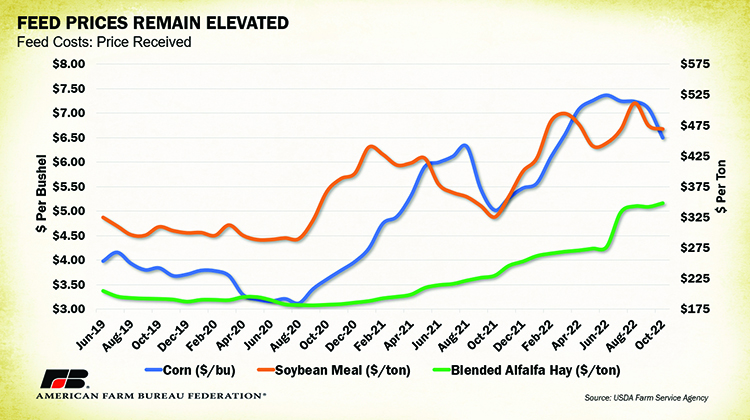
Cumulative feed costs were expected to rise nearly $11.3 billion across the farm economy in 2022. That’s 17.4% above last year and represents the largest single-expense category as detailed in Figure 2. The latest available data used to calculate the Dairy Margin Coverage Program margin shows that in October 2022, the average corn feed cost was 29% higher than 2021 ($5.02 per bushel compared to $6.50 per bushel). The average soybean meal cost was 44% higher ($325 per ton compared to $468 per ton), and the average blended alfalfa price was 51% more ($230 per ton compared to $348 per ton).
More scarce forages
Persistent Western drought continues to pressure hay supplies. Nine of the top 10 hay-producing states, which represent over 53% of hay production by value, are still affected by moderate drought or worse. Widespread low-quality or insufficient forage means farmers must look elsewhere for a smaller supply of feed at exorbitant prices, often located a long distance from the farm.
In our summer drought survey of over 650 farmers across the West, 72% of respondents reported traveling long distances to acquire feed and forage, with 66% selling off portions of their herd due to drought conditions (largely beef herds). Of the 67% of farmers who reduced livestock herds last year, nearly 50% were further reducing their herd this year, 37% were maintaining the reduced herd size, and only 14% were rebuilding their head count. Heightened feed costs and limited access to forage have led to the closure of dairy farms, especially in drought-stricken states, despite the milk price records.
Fertilizer costs, up 50% over last year with little relief in sight, were also responsible for higher feed costs. Heavily correlated with the cost of natural gas, nitrogen-based fertilizer prices will be propped up by demand for heat throughout the winter.
Speaking of fuel, total costs of fuels and oils are also forecast up 50% from last year — moving from $13.9 billion to $20.5 billion across the farm economy. The recent declines in diesel prices offer relief for on-farm fuel costs and are also a welcome prospect for farmers responsible for check deductions for hauling milk, though rates remain well above the five-year average.
Transportation disruptions continue to hamper the movement of inputs and feed and elevate the cost for farmers to market goods, but recent measurable improvements in railway service and a better flow of barge traffic on a rising Mississippi River are positive developments moving into the new year. A strong farm level income relies on a fluid and reliable transportation sector.
Could be up threefold
The ongoing impacts of inflation add even more uncertainty for farmers purchasing inputs and preparing budgets for 2023. In recent years, interest expenses have hovered around 5% of total farm production expenses. As the Federal Reserve Bank attempts to fight inflation with a series of frequent interest rate hikes, farmers will face interest rates double or triple what they were in past years.
In 2022, interest costs were expected to total over $27 billion, a 41% jump from 2021. This complicates farmers’ abilities to access affordable operating lines of credit and pay down debt. It also means higher milk checks don’t go as far.
So, what about the farmers who were able to cover their expenses and buffer against inflation in 2022? Maybe it’s time for a new milking parlor or to embrace robotic milking. However, most farmers are likely just trying to cover losses from previous years before they can go all in on upgrades.
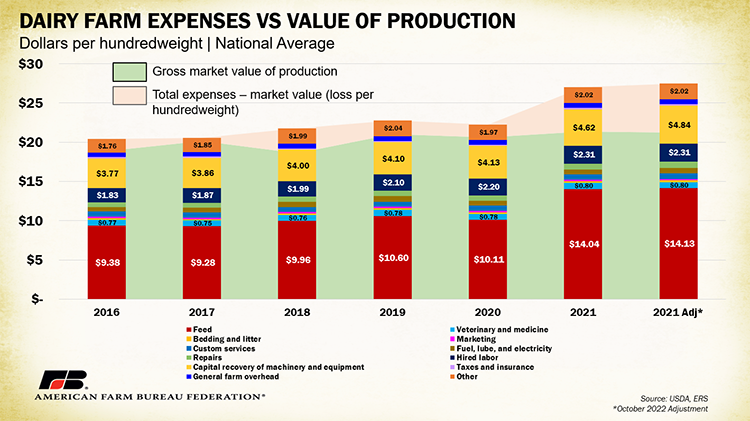
Let’s take 2021, for example. Figure 3 displays common dairy farm expenses between 2016 and 2021 in dollars per hundredweight of milk produced. 2021 is presented twice to show the original forecast from May 2022 next to the new forecast from October. We see the clear impacts of feed, which includes purchased feed, homegrown feed, and grazed feed, ranging from a low of $9.28 per cwt. in 2017 to $14.13 in the updated October 2022 forecast for 2021. Hired labor, another costly piece of the equation, has climbed by 12% since 2016 ($1.83 per cwt. to $2.31 per cwt.) and is highest in Oregon, Maine, and Vermont, states with comparatively stringent farm labor regulations.
Behind the cost bars, Figure 3 also displays the average gross market value of production in green to represent the market value of goods produced and sold by dairy farms. This includes income from milk sales, cattle sold, leasing stock, renting space to other operations, cooperative patronage dividends, and the fertilizer value of manure.
In light red is the difference between the total average production expenses and average gross market value of production. This represents the loss per hundredweight dairy farmers, on average, have had to absorb each year to remain in business. In 2021, for each $27.50 per cwt. spent, dairy farmers received only $21.23 per cwt., a loss of $6.27 per cwt. This is the largest loss within the time frame analyzed and is a negative 58-cent difference from the May 2021 forecast. That was 291% higher than 2020, when the loss was $1.60 per cwt.
Of the 20 states analyzed, California had the smallest magnitude of average losses ($2.48 per cwt.) compared to Northeastern states like Maine and Vermont, which had average losses of over $13 per cwt. These estimates can also be broken down by farm size and, for 2021, yielded a negative margin across all size categories. For farms with fewer than 50 cows, the magnitude of loss was far greater at $20.58 per cwt. versus $3.79 per cwt. for farms with over 2,000 cows. The 2022 estimates won’t be available for some time, but we can connect the dots on the likelihood of 2022 prices fully offsetting 2021 losses and beyond.
So, now what? Why not take the great press on expected record farm receipts and enjoy the high times? We should, to an extent. But we cannot overlook the realities that many farmers face, especially as we venture into farm bill discussions. One good year, depending on a farmer’s specific situation, does not reflect the overall status of dairy producers or farmers in general.
The long-term solution? Modernization of our milk pricing system and expansion of price risk management options can sure help. Thankfully, at the American Farm Bureau Federation, our hardworking team of farmers known as the Dairy Working Group — leaning heavily on the consensus items from the industry-wide AFBF-led Federal Milk Marketing Order Forum in October — have come up with a succinct set of recommendations that can help dairy farmers shield margins long term.