Think globally, act locally. It’s an oft-quoted rallying cry spoken at environmental policy conferences. However, both dairy trade and scientific literature tend to report on environmental impacts and results within geo-political boundaries, bringing attention to the major dairy producing countries. In doing so, a major facet of sustainability — to keep people fed with safe nutritious food — is often sidestepped.
According to the International Farm Comparison Network (IFCN), the growing demand for milk and dairy products is already greater than the current supply. These days, the calls for more dairy products come from low-income countries in which there are often deficits in resources, technology, skills, and/or cattle. These limitations restrict their dairy industry’s ability to satisfy domestic demand. As a result, nations resort to importing milk and dairy products.
As demand grows for dairy products, several key global milk-producing regions are reducing cattle populations to meet mandated future greenhouse gas (GHG) emission goals. These include countries such as the Netherlands, New Zealand, and France. “Major food marketing companies are searching for new suppliers to meet the increasing demand of their customers,” shared John Metzger, senior director of food industry engagement at Elanco. “They are increasingly looking to the United States,” he went on to say.
The United States ranks second in the world, next to India, which is not a milk exporting nation, in annual milk production at 226.3 billion pounds in 2021. While 2022 data is available in some countries, 2021 data will be the foundation for a direct yearly comparison. Among the major dairy-producing nations, the U.S. ranks first in annual milk per cow at 23,949 pounds per year, followed by Denmark at 22,259 pounds and Canada at 21,267 pounds. With respect to dairy exports, the U.S. ranks third to New Zealand and the 27 countries of the European Union, having exported 17.1% or 38.7 billion pounds of milk equivalents in 2021.
The positive, untold story
Herein lies the overlooked positive impact U.S. milk producers are having on the mitigation of GHG emissions, also known as the carbon footprint, for the global dairy industry. Lacking both affordable mitigation tools and approved rumen technology to reduce methane (CH4), the most prevalent GHG source from dairy farming, the most effective way to reduce methane emissions is by improving milk production efficiency as measured by milk per cow.
Because U.S. producers have, on average, the highest milk per cow in the world, milk from U.S. dairy cows has the lowest enteric or rumen produced methane footprint per gallon of milk. That being the case, U.S. producers are helping importing nations avoid elevating their carbon footprint and thereby mitigating the overall global carbon footprint.
A country-by-country comparison
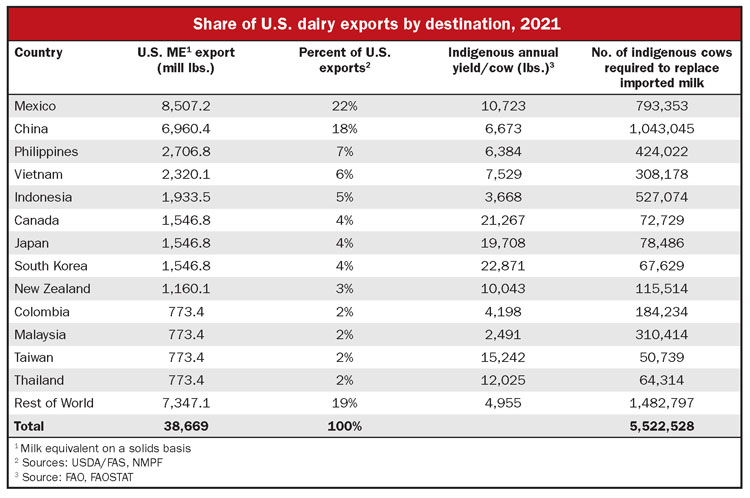
Details in the table break down U.S. dairy exports in 2021 by country of destination to help support this assessment. Thirteen countries import 81% of the dairy products, exported from the U.S., Mexico and China accounted for 40%. By considering a circumstance in which a country was no longer able to import milk, and that product could only be replaced with domestically produced milk, we can determine the number of additional milking cows required in the importing country.
Using Mexico as an example, they imported 8.5 billion milk equivalent pounds from the U.S. in 2021. If this milk was to be produced in country by Mexico, then the nation would need 793,000 more cows. One arrives at that number by dividing 8.5 billion by the native annual yield per cow of 10,723 pounds per year. Indeed, Mexico would need the equivalent of all the dairy cows in Idaho and Vermont to replace the lost U.S. imports.
Making this calculation for each country and summing them, the total number of global cows required to replace U.S. exported milk would be 5.52 million plus their respective replacement heifers.
When adjusting for the number of U.S. cows required, accounting for 2021 U.S. imports (100 million-pound equivalent) and for the 1.62 million U.S. cows that produced the exported milk, we find the balance is a savings of slightly more than 3.9 million cows. That is approximately the dairy cow population of Germany or the combined populations of California, Wisconsin, Idaho, and New York. To make a conservative estimate of the savings of enteric methane emissions, we only need to account for maintenance energy requirements for the 3.9 million cows. There is no savings from the lactation energy required because the milk is still being produced by U.S. cows.
At an average of 15 pounds of dry matter intake per cow per day for maintenance, that requires 10.7 million tons of feed annually on a dry matter basis. Each pound of feed will result in an average of 0.21 pound of enteric methane, resulting in approximately 2.04 million metric tonnes (MMT) of methane annually. Converting to the carbon footprint, the savings is 55.4 MMT of carbon dioxide-equivalent (CO2-e). This is for the cows only.
Accounting for replacement heifers to support the cows will nearly double the annual carbon dioxide equivalent savings. Furthermore, it is only a fraction of the savings. Savings of carbon dioxide equivalent from other sources like manure generated methane, electricity, and fuel use have not been factored in, nor have other savings such as land and water been estimated for this example.
Critics of long-haul movement of food claim that transportation is a substantial environmental cost. While there is some cost, when considered on a per-pound basis of milk, it is typically 2% to 4% of the overall environmental impact. This minimal cost is a major reason why it is environmentally responsible to grow human food where it can be grown with the fewest amount of resources and move it to where the demand exists.
Through a domestic lens
This is a simple illustration of thinking globally when evaluating the U.S. carbon footprint. If we evaluate the domestic impact of the national dairy herd, then we should appropriately subtract the cows and milk that is not consumed domestically. This means that a U.S. carbon footprint evaluation should only be made on the 7.84 million cows required to produce domestically consumed milk and dairy products (187.6 billion pounds milk equivalent) in 2021.
Comparing these statistics to 1985 when milk exports were basically nonexistent, there were 10.9 million cows that produced 143 billion pounds of milk. Consequently, in 36 years, U.S. dairy farmers are producing 31% more domestically consumed milk with just 72% of the cows.
The narrative does change by separating the milk and cows for domestic dairy product needs from exported milk. It shows how U.S. dairy farmers have continued to improve environmental impact for both the domestic market and the global market.
In the fossil fuel business, consuming countries are charged for the carbon footprint of burning imported oil, gas, and coal. Why is exported food not evaluated the same way instead of charging it all to the producing country? If it were so, then we would truly be impacting sustainability globally by giving credit to exporting nations for the efficiencies gained within their own borders.