The costs to produce milk vary widely among operators in different geographical regions of the United States as well as on different-sized operations. USDA has tracked the annual regional and national cost of production data for many decades, helping the industry to calculate profitability measures and identify areas where costs are changing over time as well as which costs vary the most in different regions.
Producer input through the Agricultural Resource Management Survey (ARMS) generates the data. Though data is available annually, ARMS producer surveys are only conducted every few years to capture industry changes in productivity and technology. According to the USDA’s Economic Research Service (ERS), “Estimates made in the survey year should be regarded as the most reliable because the estimates reflect both prices and technologies used on the commodity.”
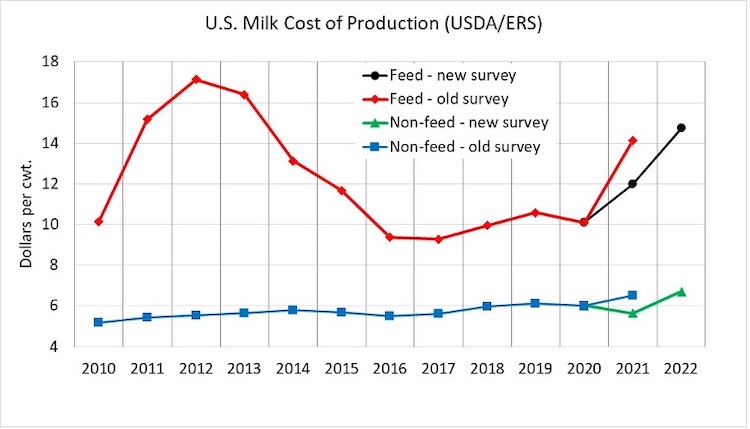
A new ARMS survey occurred for milk in 2021, and data became available this spring. Relative to the previous survey base year of 2016, the reported 2021 U.S. milk operating cost of production was lowered by more than $3 per hundredweight (cwt.). More than $2 of this change was attributed to a reduction in feed costs.
While ERS reports a 23% increase in feed costs associated with milk production from 2021 to 2022 and a 19% increase in nonfeed cash costs, the reported declines in the cost of production from using the 2021 ARMS survey leave the 2022 data only marginally higher than the 2021 data previously reported based off of the 2016 survey.
ERS also provides a breakdown of how production costs differ by size of operation. In 2022, operations with more than 2,000 cows reported cash costs that were $1.50 per cwt. lower than the average across all sizes of operations, with the majority of the decline due to lower nonfeed costs. In 2020, the last year of data by group size from the 2016 survey base, this largest category of operations posted costs nearly $3 below the average.
U.S. average milk production costs continue to be influenced by a larger percentage of milk being produced in operations with 2,000 or more cows. USDA’s milk production costs will be one factor considered as dairy safety is debated in the next farm bill. A comparison of individual operations’ production costs to these aggregate costs can indicate areas where these operations can focus on reducing costs. This data also highlights the economies of scale in dairy operations today.


